 Stay
Stay 
Trading Conditions
Products
Tools


EUR/USD 5M
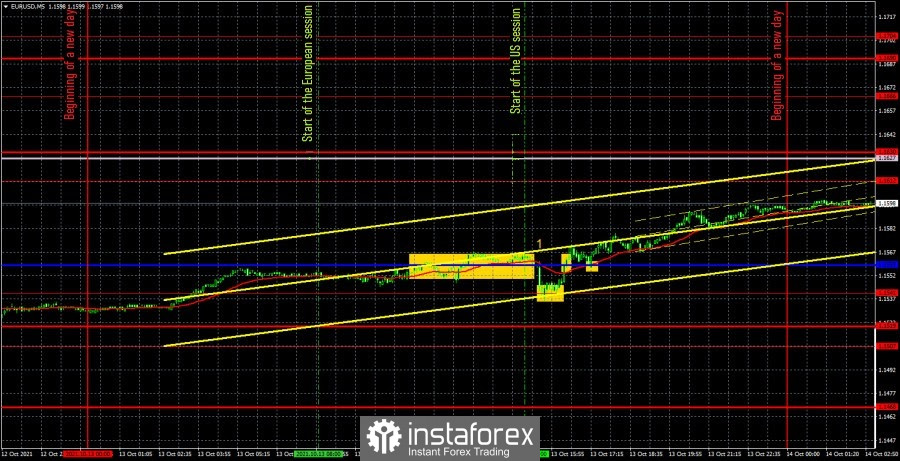
The EUR/USD pair showed little volatility on Wednesday. Yes, days earlier it was even less, while on Wednesday 50 points were passed from the low to the high of the day. However, just think: for us 50 points volatility per day is already becoming an event! Thus, we remain in our opinion: the current movements of the euro/dollar pair remain extremely weak, so it is very difficult to trade the pair now, even on the smallest timeframes. Also, pay attention to the fact that Bollinger bands are directed sideways on the 4-hour TF, which indicates a flat. Absolutely every trader can see this, the indicator settings are standard. Thus, the flat is carried over to the hourly timeframe, and on the 5-minute timeframe it looks like a weak movement. But this should not mislead us. For example, in recent reviews we said that in a flat the Ichimoku indicator lines lose their strength and should not be considered a source of signals. That was exactly what happened yesterday. The price crossed the critical line several times, and after the fact it is clear that all these overcomes were false. Therefore, we do not consider all the trading signals that were formed near the Kijun-sen line. Thus, the only signal of the day is a rebound from the level of 1.1541, after which the price went up by about 20 points. Thus, a long position should have been manually closed at about 20 points in profit in the evening. We also note that yesterday, the United States published a report on inflation for September (figure "1" in the chart). The consumer price index rose from 5.3% y/y to 5.4% y/y, and traders initially reacted logically to it - buying the US dollar. However, literally an hour later, the pair turned upward and the euro sharply began to rise. Therefore, on the whole, the inflation report made no sense for trading.
EUR/USD 1H
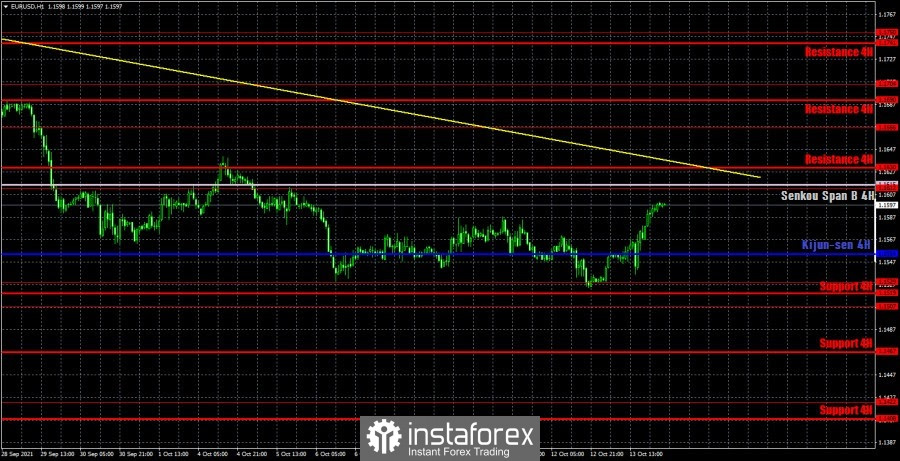
You can see that the euro/dollar pair still cannot correct to the downtrend line on the hourly timeframe and continues to remain at some distance from it. Thus, the downward trend continues, but since the price still crossed the critical line, the correction to the trend line is possible. However, we now recommend paying attention to the Bollinger Bands indicator on the 4-hour TF. At this time, it indicates a flat. We highlight the following levels for trading on Thursday - 1.1507, 1.1529, 1.1612, as well as the Senkou Span B (1.1615) and Kijun-sen (1.1554) lines. The Ichimoku indicator lines can change their position during the day, which should be taken into account when looking for trading signals. Signals can be rebounds or breakthroughs of these levels and lines. Do not forget about placing a Stop Loss order at breakeven if the price moves 15 points in the right direction. This will protect you against possible losses if the signal turns out to be false. Until the Bollinger Bands begin to widen up or down, the signals from the Ichimoku lines should be ignored. No important publication or other event planned in the European Union on October 14. It is also an almost absolute wasteland in America. It is possible to note only a few speeches by representatives of the Federal Reserve, as well as applications for unemployment benefits. However, if the markets reacted 20 points to the inflation report, what would be the reaction to the report? 5 points?
We also recommend that you familiarize yourself with the forecast and trading signals for the GBP/USD pair.
COT report
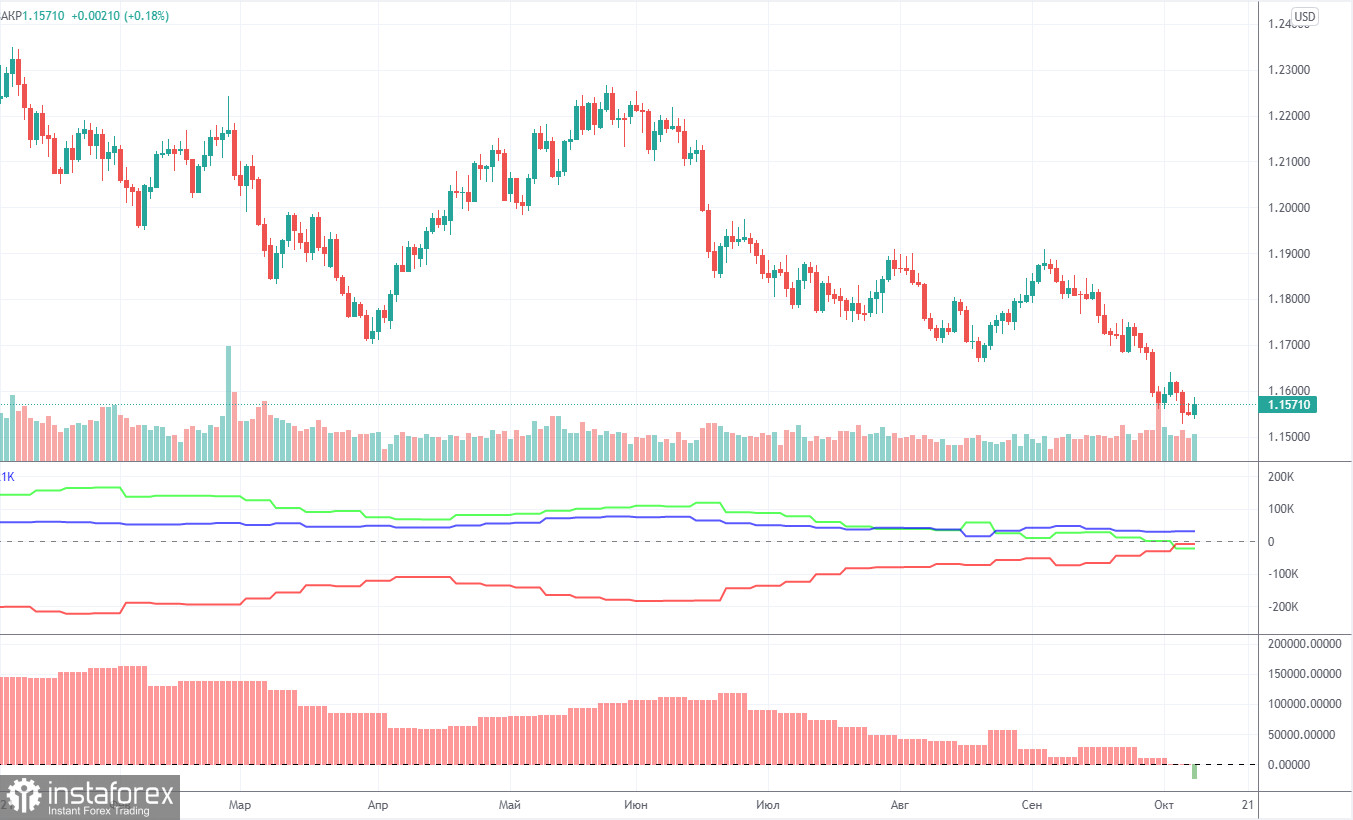
The mood of non-commercial traders became fully bearish during the last reporting week (September 28 - October 4). If a week earlier the number of buy and sell contracts for major players practically coincided, then after the next Commitment of Traders (COT) report the balance of forces changed in favor of the bears. During the reporting week, professional traders opened 26,000 sell contracts (shorts) and only 2.5 thousand buy contracts (longs) of the euro. Thus, the net position of the "non-commercial" group decreased immediately by 23,500, which is a lot even for the euro. At the same time, the total number of buy contracts became less than the number of sell contracts. Now the first 198,000 ones are open for large players, and the second - 220,000.So now it is already possible to announce that the mood for the euro currency has formed bearish, which significantly increases the likelihood of a further fall in the EU currency. The first indicator in the chart above, which displays the change in net positions of all groups of traders, clearly shows that the green line has gone below zero, and the red line is about to cross it from the bottom up. Thus, traders can immediately receive a double signal for a further fall in the euro. First, the red and green lines will intersect, which indicates a change in mood. Secondly, both of these lines will cross the zero mark, which indicates the same thing. In general, based on the COT reports, the likelihood of a further fall in the euro is growing. Technique is now saying the same thing.
Explanations for the chart:
Support and Resistance Levels are the levels that serve as targets when buying or selling the pair. You can place Take Profit near these levels.
Kijun-sen and Senkou Span B lines are lines of the Ichimoku indicator transferred to the hourly timeframe from the 4-hour one.
Support and resistance areas are areas from which the price has repeatedly rebounded off.
Yellow lines are trend lines, trend channels and any other technical patterns.
Indicator 1 on the COT charts is the size of the net position of each category of traders.
Indicator 2 on the COT charts is the size of the net position for the non-commercial group.
InstaForex analytical reviews will make you fully aware of market trends! Being an InstaForex client, you are provided with a large number of free services for efficient trading.

