 Stay
Stay 
Trading Conditions
Products
Tools


Trend analysis (Fig. 1)
Today, the price from the level of 1.1593 (closing of yesterday's daily candle) will try to make a downward pullback to be able to test the level of 1.1583 – the pullback level of 23.6% (red dotted line). After reaching this level, it may further rise to the target of 1.1615 – the pullback level of 23.6% (yellow dotted line). Once this level is tested, the upward movement may extend.
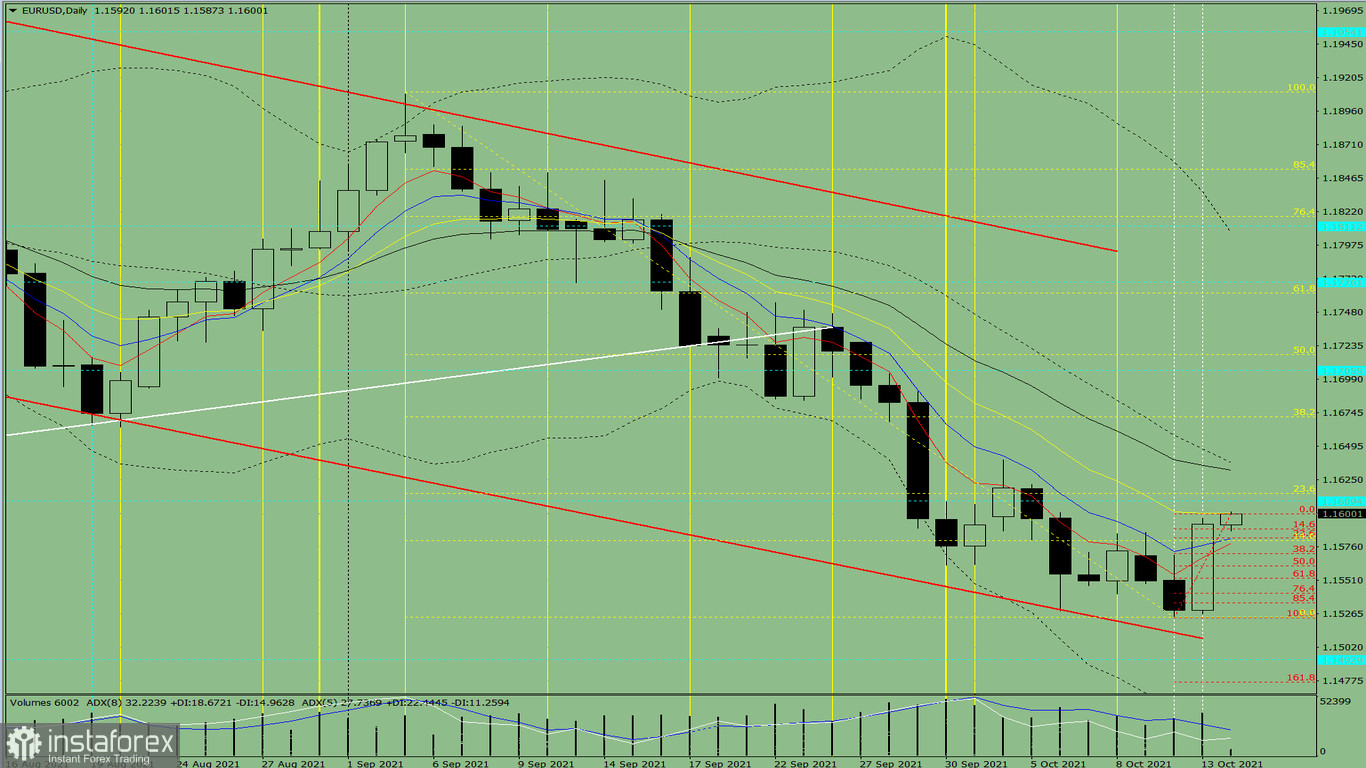
Figure 1 (daily chart)
Comprehensive analysis:
General conclusion:
The price from the level of 1.1593 (closing of yesterday's daily candle) will attempt to pullback down today in order to test the level of 1.1583 – the pullback level of 23.6% (red dotted line). After reaching this level, it may continue its growth to the target of 1.1615 – the pullback level of 23.6% (yellow dotted line). Once tested, the continuation of the upward movement can be expected.
Alternatively, the price from the level of 1.1593 (closing of yesterday's daily candle) may try to start declining in order to test the level of 1.1571 – the pullback level of 38.2% (red dotted line). After this level is reached, the price may further rise to the target of 1.1615 – the pullback level of 23.6% (yellow dotted line).
InstaForex analytical reviews will make you fully aware of market trends! Being an InstaForex client, you are provided with a large number of free services for efficient trading.

