 Stay
Stay 
Trading Conditions
Products
Tools


Analysis of previous deals:
30M chart of the EUR/USD pair
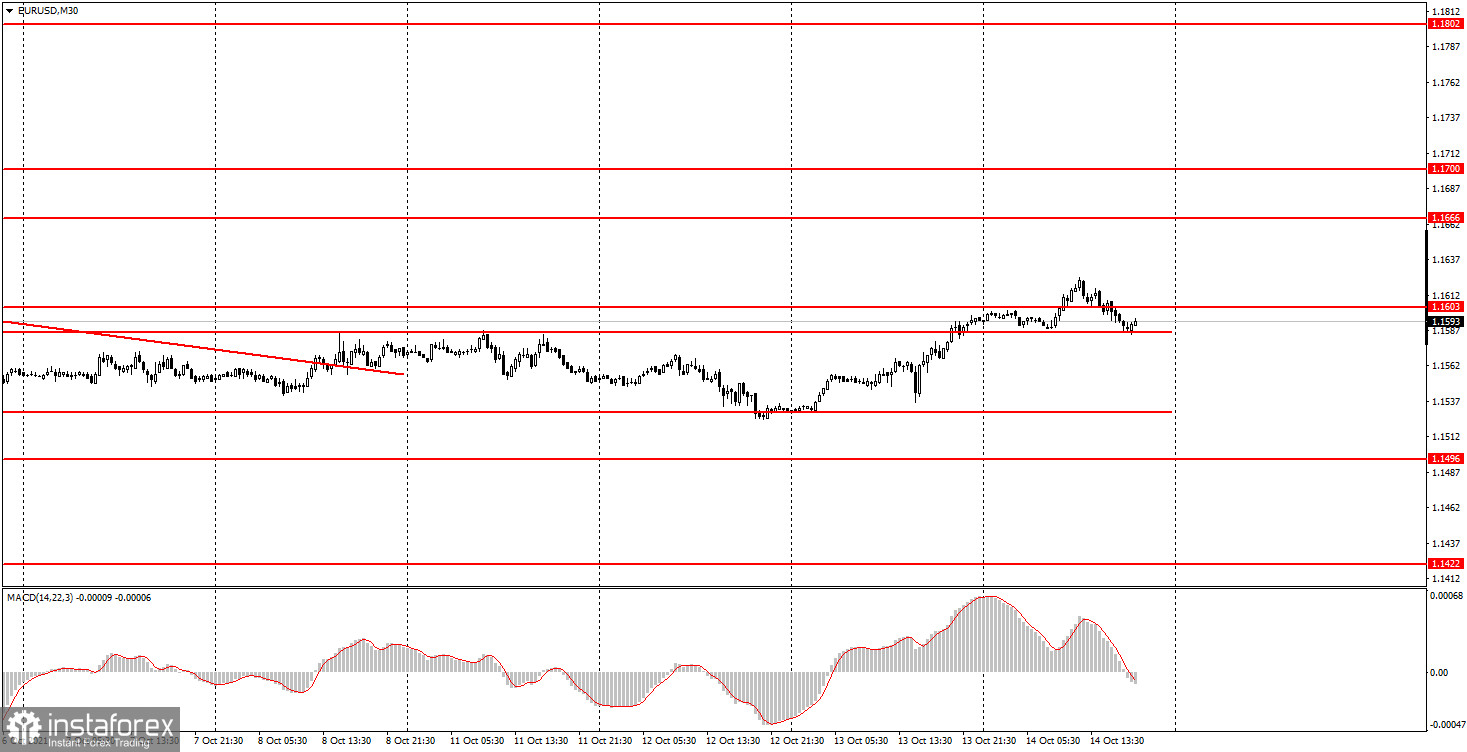
The EUR/USD pair managed to get out of the horizontal channel on Thursday after a six-day stay in it. However, this consolidation 20-25 points above the channel cannot be called a formed upward trend. Thus, it is still too early to open champagne and count on a new upward trend. And, in principle, the trend too. Volatility continues to be very low. In the vast majority of cases, the pair passes no more than 40-50 points a day. Of course, even with such volatility, you can count on some profit, but still, when the pair moves in the usual mode, there is more profit, and there are fewer false signals. There has also been no major macroeconomic report or other fundamental event today. The EU and US news calendars were completely empty. Thus, the markets had nothing to react to during the day. What is more valuable is for the price to overcome the upper border of the horizontal channel. It could mean that the markets are now aiming for an upward trend. But, as already mentioned, there is no trend line at the moment.
5M chart of the EUR/USD pair
The technical picture also looks quite eloquent on the 5-minute timeframe. Low volatility is clearly visible, but nevertheless, three trading signals were formed during the day. Let's take a look at them and understand how you should have traded on Thursday. The first buy signal in the form of overcoming the level of 1.1603 was formed at the European trading session. After it, the price went up about another 13 points, which was not enough even to place a Stop Loss order at breakeven. Subsequently, the price first returned to the level of 1.1603, and then completely settled below it, having brought a loss of 13 points. Since the price consolidated below the level of 1.1603, it was also possible to consider short positions here, however, at that moment, a false signal near 1.1603 had already been generated twice, so the third signal near it should not have been worked out. As a result - minimum loss.
How to trade on Friday:
The flat was canceled on the 30-minute timeframe, but the trend has not yet formed, and the volatility in most cases does not exceed 40-50 points. Thus, it is still very inconvenient to trade on the 30-minute TF, and we still do not recommend tracking signals from the MACD indicator. The key levels on the 5-minute timeframe for October 15 are 1.1529, 1.1580, 1.1603, 1.1639. Take Profit, as before, is set at a distance of 30-40 points. Stop Loss - to breakeven when the price passes in the right direction by 15 points. At the 5M TF, the target can be the nearest level if it is not too close or too far away. If it is, then you should act according to the situation or work according to Take Profit. The European Union will not have any macroeconomic statistics on Friday, and the US is scheduled to publish the consumer confidence index from the University of Michigan, as well as a report on retail sales for September. In certain situations, the markets may react to this data, but for this it is necessary that the actual values differ greatly from the forecasted ones.
On the chart:
Support and Resistance Levels are the Levels that serve as targets when buying or selling the pair. You can place Take Profit near these levels.
Red lines are the channels or trend lines that display the current trend and show in which direction it is better to trade now.
The MACD indicator (14,22,3) consists of a histogram and a signal line. When they cross, this is a signal to enter the market. It is recommended to use this indicator in combination with trend lines (channels and trend lines).
Important speeches and reports (always contained in the news calendar) can greatly influence the movement of a currency pair. Therefore, during their exit, it is recommended to trade as carefully as possible or exit the market in order to avoid a sharp price reversal against the previous movement.
Beginners on Forex should remember that not every single trade has to be profitable. The development of a clear strategy and money management are the key to success in trading over a long period of time.
InstaForex analytical reviews will make you fully aware of market trends! Being an InstaForex client, you are provided with a large number of free services for efficient trading.

