 Stay
Stay 
Trading Conditions
Products
Tools


Here are the details of the economic calendar for October 14:
Yesterday, America's producer prices were released, which accelerated from 8.3% to 8.6%. The factor is positive but was expected in the market.
The lever in favor of dollar positions was played by the indicators on applications for unemployment benefits in the United States, where their volume decreased more than forecast.
Details of statistics:
The volume of initial applications for benefits fell from 329 thousand to 293 thousand, with a forecast of 319 thousand.
The volume of repeated applications for benefits fell from 2,727 thousand to 2,593 thousand, with a forecast of 2 675 thousand.
The recovery in the labor market, paired with data on producer prices, locally stimulated dollar positions.
Analysis of trading charts from October 14:
The EUR/USD pair reached the level of 1.1624 during the correction from the support area of 1.1529, where a slight pullback-stagnation occurred. Considering the price changes, it can be seen that the correctional course was oriented towards the local high on October 4, where the current stagnation arose.
Despite the euro's strengthening, the market is still dominated by downward interest, as indicated by the trend from the beginning of June.
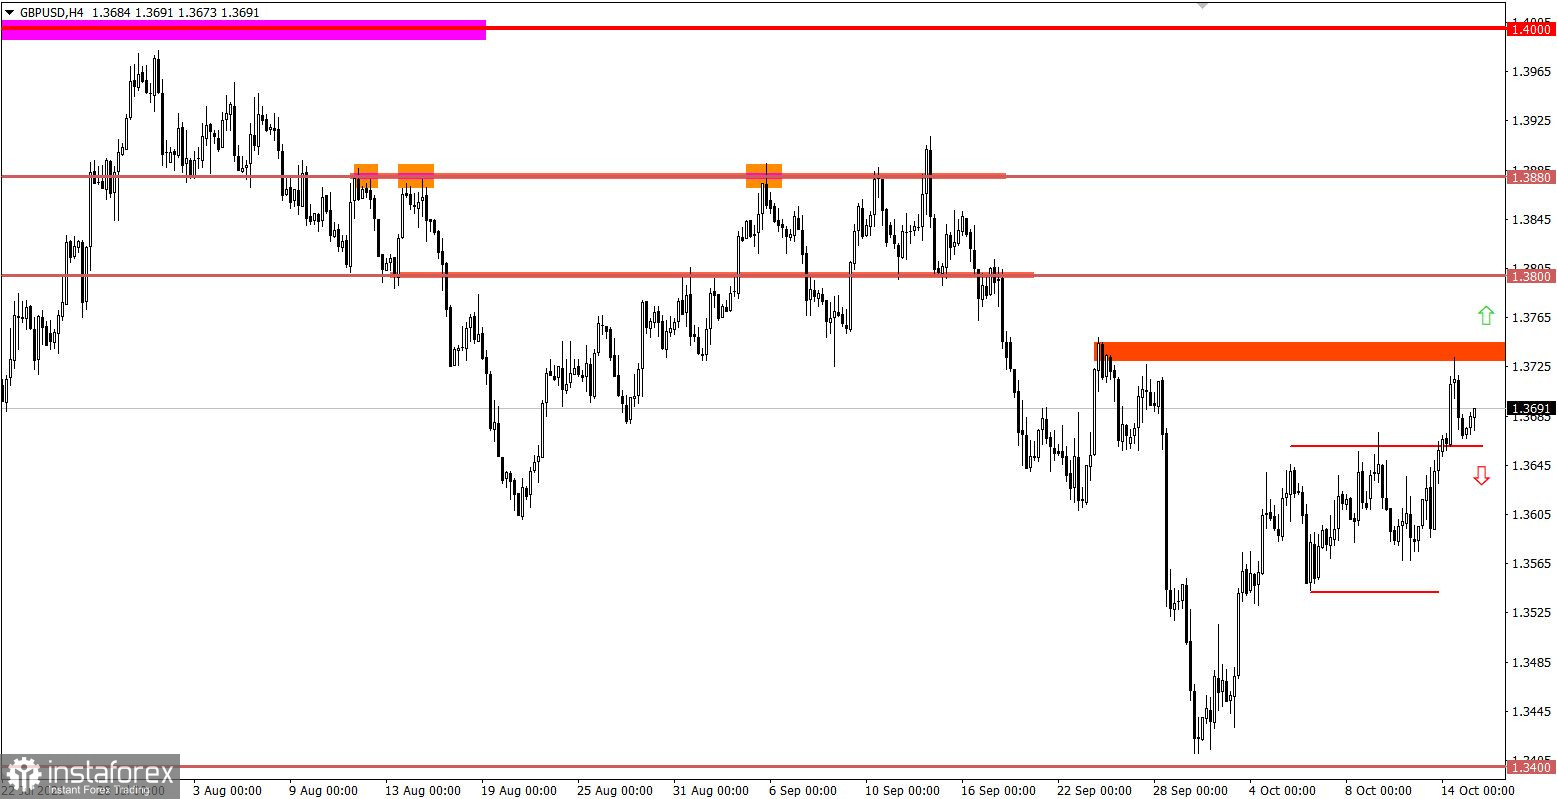
The GBP/USD pair rebounded accurately from the area of the local high (1.3730/1.3750) of September 23. As a result, the quote returned to the upper limit of the previously overcome side channel of 1.3540/1.3670.

October 15 economic calendar:
Today, the US retail sales data are expected to be published, which may slow down from 15.1% to 9.0%. The factor is not the best for the US market, so if expectations coincide, the US dollar may come under local pressure.
Trading plan for EUR/USD on October 15:
There are two possible scenarios in the current condition:
The first one comes from the euro's high level of oversold, where the corrective move is not enough for a complete regrouping of trading forces. In this case, holding the price above the local high (1.1640) of October 4 will lead to a movement towards the resistance level of 1.1700.
The second scenario considers the prolongation of the descending cycle. The return of the price below the level of 1.1580 will lead to an increase in the volume of short positions. This will open the way first to the local low (1.1524) of October 12, and then to the prolongation of the downward cycle.
* Oversold market – a situation where prices have dropped too low and quickly. In this case, we are talking about the euro, which has weakened by 3% since the beginning of autumn.
Short positions or Short means sell positions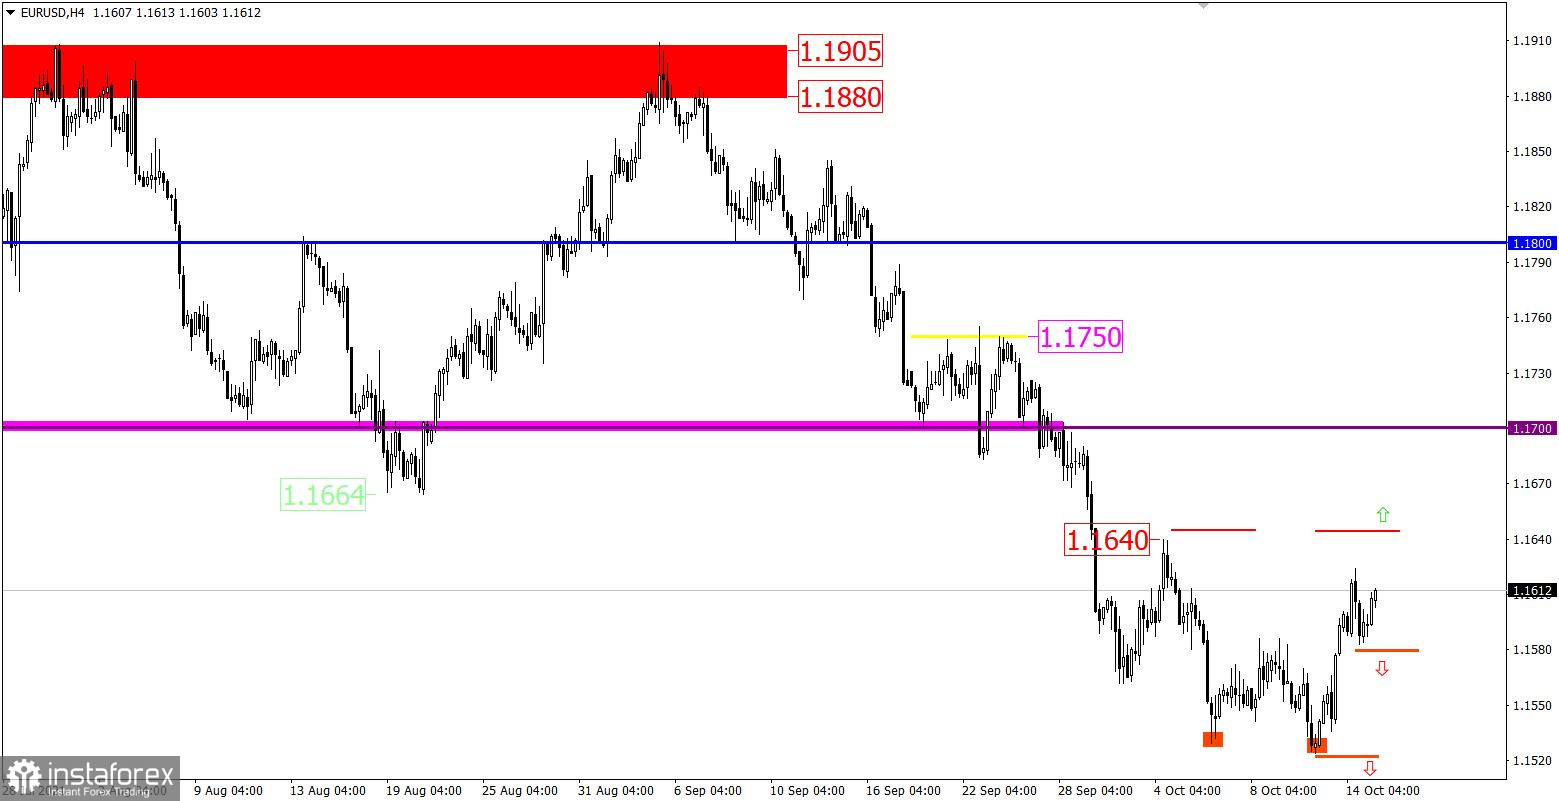
Trading plan for GBP/USD on October 15:
The area of the local high of 1.3730/1.3750 still has a double effect on buyers. This can lead to a slowdown and the end of the corrective course. The sell signal will arrive if the price is kept below the level of 1.3645.
In case of prolongation of the correction, the buy signal will be relevant if the price is kept above the level of 1.3755. This will open a local entry towards the resistance level of 1.3800.
What is reflected in the trading charts?
A candlestick chart view is graphical rectangles of white and black light, with sticks on top and bottom. When analyzing each candle in detail, you will see its characteristics of a relative period: the opening price, closing price, and maximum and minimum prices.
Horizontal levels are price coordinates, relative to which a stop or a price reversal may occur. These levels are called support and resistance in the market.
Circles and rectangles are highlighted examples where the price of the story unfolded. This color selection indicates horizontal lines that may put pressure on the quote in the future.
The up/down arrows are the reference points of the possible price direction in the future.
InstaForex analytical reviews will make you fully aware of market trends! Being an InstaForex client, you are provided with a large number of free services for efficient trading.

