 Stay
Stay 
Trading Conditions
Products
Tools


To open long positions on GBP/USD, we need the following conditions:
On Friday, there were several clear signals to open long and short positions on the British currency. Let's look at the 5M chart and figure out the entry points. In the first half of the day, one long signal was formed on the pound sterling. After that, the price rebounded upwards by 40 pips. Bulls were able to defeat the support level of 1.3777 thanks to strong economic data on PMI indexes. The formation of a false breakout indicated a good opportunity to open long positions. In the afternoon, after the release of strong PMI data in the United States, the pair broke through and tested the 1.3777 level. It was a signal to open short positions. The drop was more than 30 pips. A false breakout of 1.3744 at the end of the American session gave a buy signal.
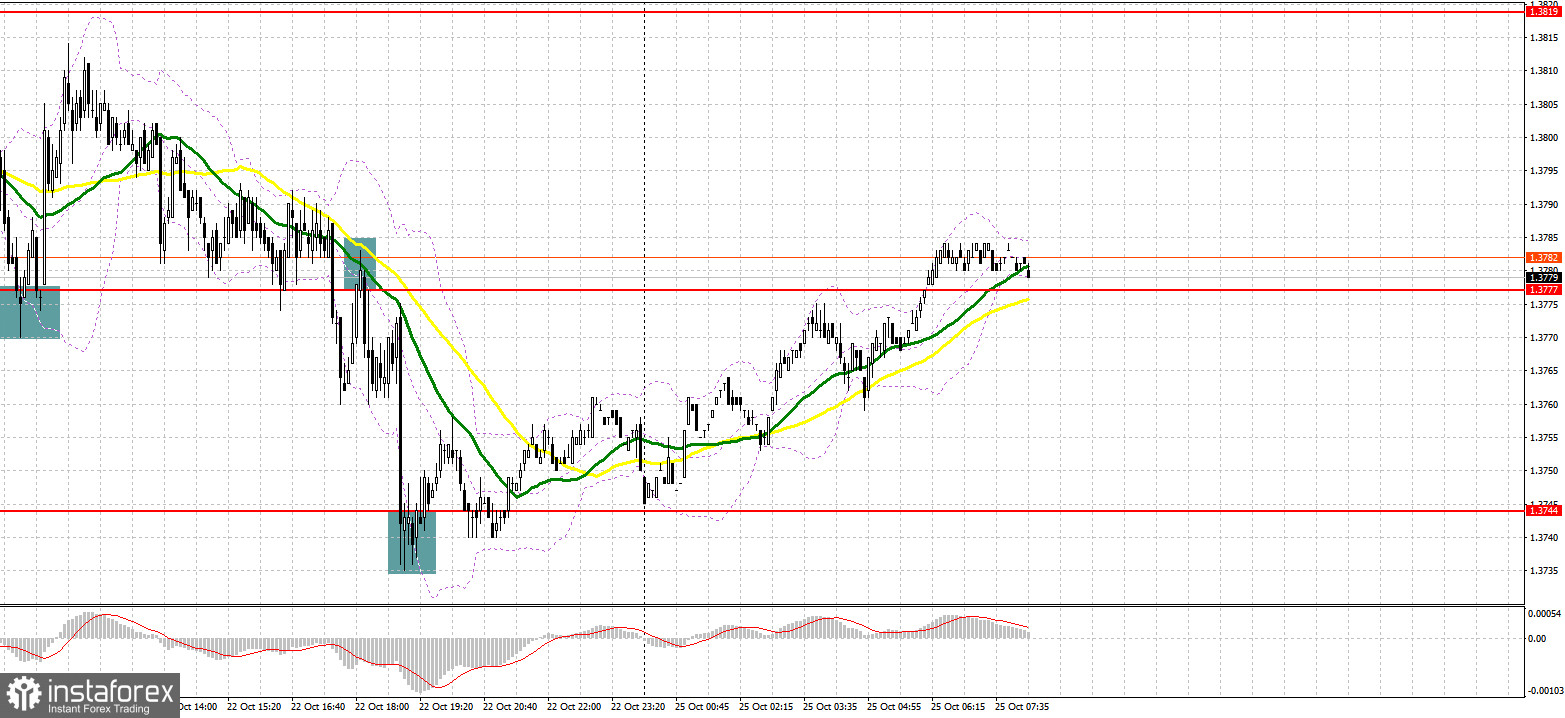
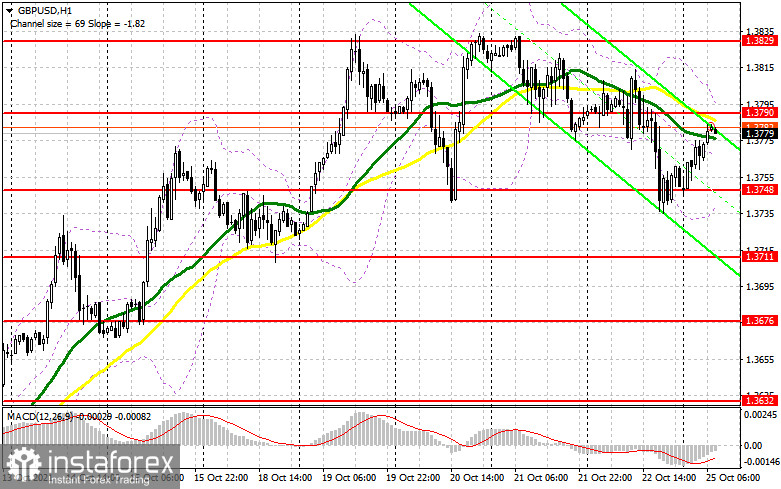
Today, the economic calendar remains empty. For this reason, the pair is likely to be trapped in the sideways channel at the level of 1.3790. Bulls may accumulate strength near this level. Yet, they also need to protect the lower border of the sideways channel located at 1. 3748. The further short-term trajectory of the pound sterling will depend on this level. Traders are likely to place stop orders below this level. Only the formation of a false breakout will give a good entry point into long positions. If bulls manage to push the pair above 1.3790 in the first half of the day, only a test from top to bottom of this level will give a new entry point into long positions. It will also enable bulls to push the price to the upper border of the sideways channel located at 1.3829, the highs of last week. After a breakout of this range, the price is likely to reach 1.3864 and 1.3910. At these levels, it is recommended to lock into profits. If bulls are not active in the area of 1.3748, it is better to open long positions on the pound sterling at 1.3711. However, I advise you to open long positions there only after a false breakout. Open long trades on GBP/USD for a rebound only from the low of 1.3676 or from the support level of 1.3632, counting on an intraday correction of 25-30 pips.
To open short positions on GBP/USD, we need the following conditions:
Bears have all the chances to take the upper hand. They should protect the middle of the sideways channel located at 1.3790. Only the formation of a false breakout amid the lack of important economic reports will five a sell signal, pushing the pair to the lower limit of 1.3748. A breakout of 1.3748 and a test from the bottom up will give a signal to open new short positions with the possibility of a decline to 1.3711. The further target will be the level of 1.3676 level. If so, bears will regain ground. I recommend locking into profits at that level. In case of recovery of GBP/USD and bears' failure to protect 1.3790, I advise selling the pound immediately for a rebound from the resistance level of 1.3864 or from a high of 1.3910. Take into account the pair's intraday reversal by 20-25 pips.
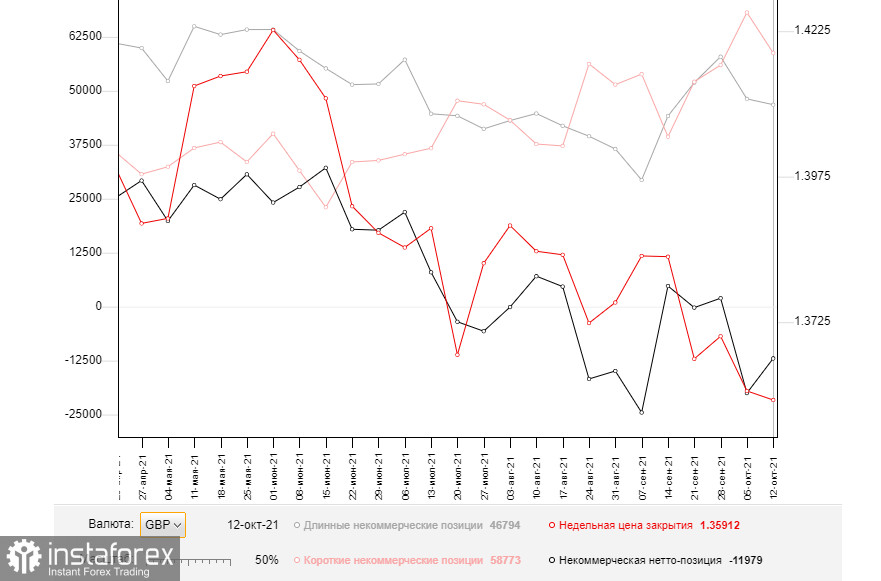
The COT reports (Commitment of Traders) for October 12 showed a decline in both short and long positions. However, short positions dropped the most, which led to a slight recovery of the net position. Despite the bears' attempts to break the bullish trend, buyers turned out to be stronger. So, the pound climbed higher against the US dollar. The US government managed to smooth the crisis driven by supply chain disruptions. Earlier, it was the main reason for a steep drop in the currency. So, demand for risky assets is gaining momentum. Statements made by BOE members to take inflation pressure more seriously also helped GBP to rise. The central bank's meeting minutes published last week confirmed the regulator's intention to raise the interest rate already during the November meeting. This is a bullish signal for GBP/USD. The bullish momentum may only be affected by the Fed's plans to taper bond purchases. Although The Fed is not going to raise the interest rate, it is likely to tighten monetary policy this year. However, the pound sterling will hardly lose momentum if this scenario is true. The COT report indicates that the volume of long non-commercial positions decreased to 46,794 from 48,137, while the volume of short non-commercial positions dropped to 58,773 from 68,155. It significantly weakened bearish momentum. As a result, the volume of non-commercial net position totaled 11,979 against 20,018. The closing price of GBP/USD remained almost unchanged at the end of the week: 1.3591 against 1.3606.
Technical indicators:
Moving averages
Trading is carried out in the area of 30 and 50 moving averages, which indicates the sideways movement.
Note: Timeframes and prices of moving averages viewed by the author on the 1H chart differ from the general definition of the classic daily moving averages on the D1 chart.
Bollinger Bands
A breakout of the upper limit of 1.3790 will trigger a new rally of the pound sterling. In case of a decline, the lower limit of the area of 1.3745 will act as support.
Description of indicators
InstaForex analytical reviews will make you fully aware of market trends! Being an InstaForex client, you are provided with a large number of free services for efficient trading.

