 Stay
Stay 
Trading Conditions
Products
Tools


Today's analysis of USD/CHF will be devoted mainly to the technical component. I will start with the fact that this currency pair is trading in no particular direction. To make sure of this, let's look at the weekly price chart.
Weekly
Looking at the highlighted bullish candle, it could be assumed that the pair went up from the Ichimoku indicator cloud, which implies further strengthening of the quote. However, the highlighted candle's rather long upper shadow played a cruel joke with the bulls on this trading instrument. Usually, such shadows indicate a lack of strength. In this case, the bulls have for the subsequent continuation of the chosen direction. I believe that this shadow did not appear by chance. The fact is that the 0.9370 mark is historically and technically quite a strong level, which has repeatedly stopped the course and changed its direction. And indeed, as we can see, after the appearance of the highlighted candle, there was a three-week decline in the quote. As a result, the price returned to the limits of the Ichimoku indicator cloud. Moreover, since the bulls could not keep the pair above the upper boundary of the cloud, after returning to its limits, the players on the downgrade made attempts to get out of the cloud down.
Last week closed under the lower boundary of the Ichimoku cloud. However, the pair was saved from the subsequent decline by the blue Kijun line, which provided strong support. However, the current situation is highly uncertain, and it cannot be called unambiguous. First, the pair is trading within the cloud, which in itself is a zone of uncertainty. Second, the Tenkan red line may limit the current growth of USD/CHF. Thus, a lot will depend on how the current weekly trading ends. Closing above Tenkan will help bring the pair up from the cloud and the subsequent retest of the 0.9367 resistance level. Although, in my personal opinion, bullish prospects will become most obvious only after the true breakdown of the orange 200 EMA and the subsequent breakdown of sellers at 0.9472. The primary task of the bears for the pair is to transfer trading under the blue Kijun line. If this task is successfully solved, the bears' next target will be a round psychological level of 0.9000. It may be where the further direction of USD/CHF will be decided in the medium term.
Daily
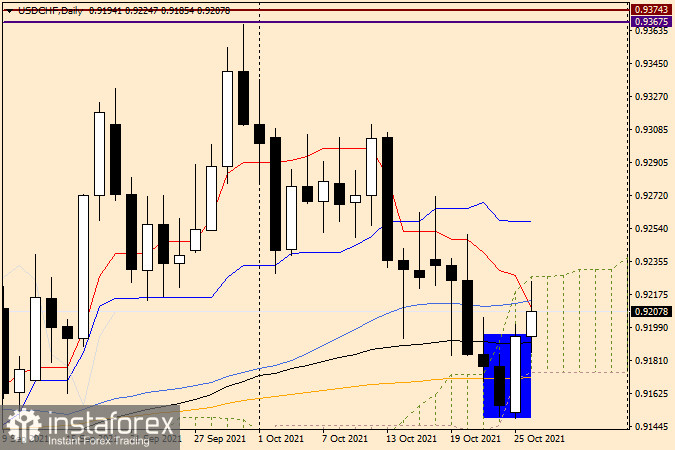
On the daily dollar/franc chart, the picture is no less mysterious. We see that, after closing one candle below the 200 exponential, very rapid growth followed, which led to the appearance of a reversal model of the "Bullish absorption" candle analysis. Today's growth, observed at the end of the review, can be perceived as a confirmation of the signal to work out the reversal pattern of Japanese candlesticks.
H1
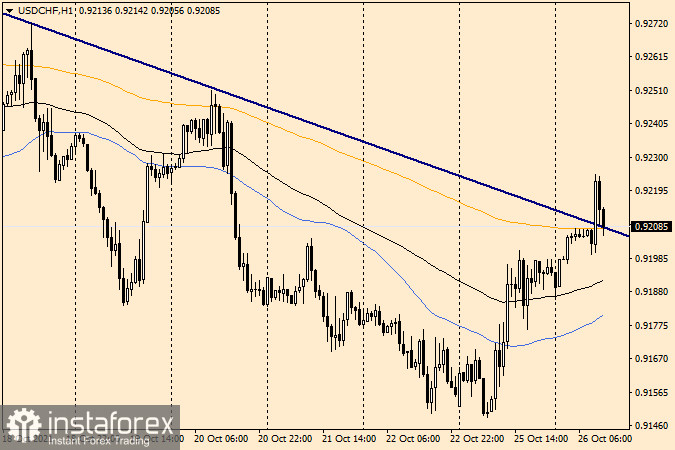
If so, then the most optimal positioning in the current conditions looks like better and safer purchases to open after short-term corrective pullbacks to the broken resistance line and the orange 200 EMA. It is exactly the kind of pullback observed now, and those who wish can use it to open long positions on USD/CHF. If the pair returns under the broken resistance line and 200 EMA, the breakdown will be considered false, and we will already start preparing for sales.
InstaForex analytical reviews will make you fully aware of market trends! Being an InstaForex client, you are provided with a large number of free services for efficient trading.

