 Stay
Stay 
Trading Conditions
Products
Tools


GBP/USD 5M
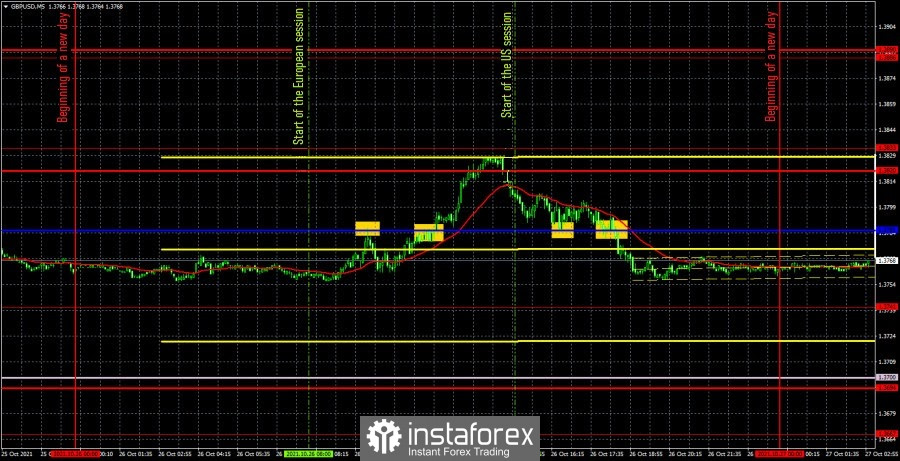
The GBP/USD pair traded quite well on October 26, but, unfortunately, it is too similar to the euro/dollar pair. Simply put, in the first half of the day, there was also an upward movement, and in the second, a downward movement. The pair's downward reversal was not associated with any macroeconomic statistics or other fundamental events. Unfortunately, just like for the euro, the pair formed false signals near the lines of the Ichimoku indicator, and also did not reach the target levels, just a few points. Thus, the trading day was not very successful. Nevertheless, let's take a look at all the trading signals and understand how you should have traded on Tuesday. The first sell signal was generated in the morning when the price just bounced off the critical line perfectly. However, the downward movement could not continue and the pair went down only 15 points, which was not enough even to place a Stop Loss order. A little later, the quotes turned up and crossed the Kijun-sen line in order to continue moving up and not reach the extremum level of 1.3833 4 points. Of course, the short position should have been closed when the price closed above the critical line. It was also possible to open long positions at this point. The short position suffered a 15 points loss. On a long position, the situation was saved only by the resistance level of 1.3820, above which the price first settled, and then went below it. It was this move below 1.3820 that should have served as a signal for traders to close long positions. The profit on the deal was 18 points. Two subsequent signals, formed near the Kijun-sen line, should be ignored, since the first two signals turned out to be false. Thus, even though we didn't manage to earn money on Tuesday, the day was still completed without losses, which is also very good.
GBP/USD 1H
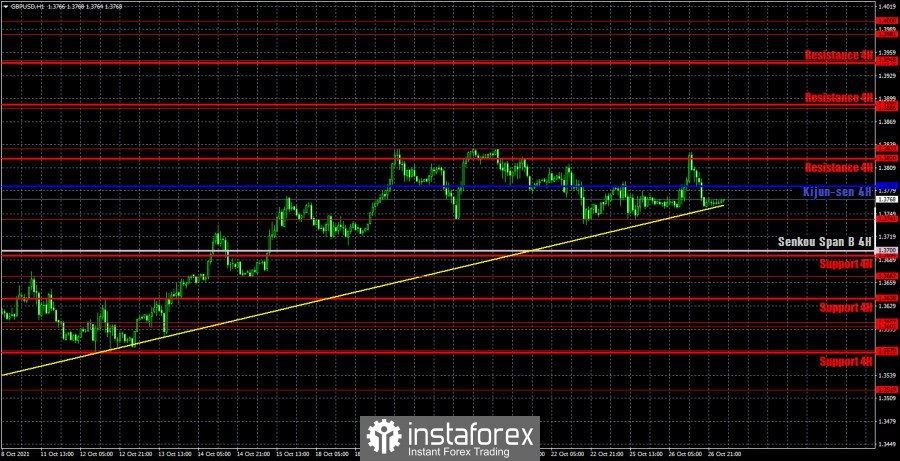
The pound/dollar pair maintains an upward trend on the hourly timeframe, but today it may be broken. The problem is that the price for the fourth time failed to overcome the level of 1.3833 and once again worked out the trend line, below which it can easily gain a foothold. This overcoming will mean that the upward trend is over. In this case, the pound sterling may become cheaper in the next few weeks, but its first target will be the Senkou Span B line. It is also worth noting that recently the pair quotes are between the levels of 1.3741 and 1.3833, that is, in a sideways channel. Thus, it is possible that the price will bounce off the level of 1.3741 and continue to move sideways. On October 27, we highlight the following important levels: 1.3667, 1.3741, 1.3833, 1.3886. Senkou Span B (1.3700) and Kijun-sen (1.3785) lines can also be signal sources. It is recommended to set the Stop Loss level at breakeven when the price passes 20 points in the right direction. The Ichimoku indicator lines can move during the day, which should be taken into account when looking for trading signals. Since the pound/dollar is now also in a flat, the Kijun-sen line is weak, like the Senkou Span B line. Nothing interesting and important is planned in the UK on Wednesday. Thus, we can assume that the macroeconomic background will be weak, if at all. As for volatility, it will most likely be around 80 points again.
We recommend you to familiarize yourself:
Forecast and trading signals for EUR/USD for October 27. Detailed analysis of the movement of the pair and trade deals.
COT report
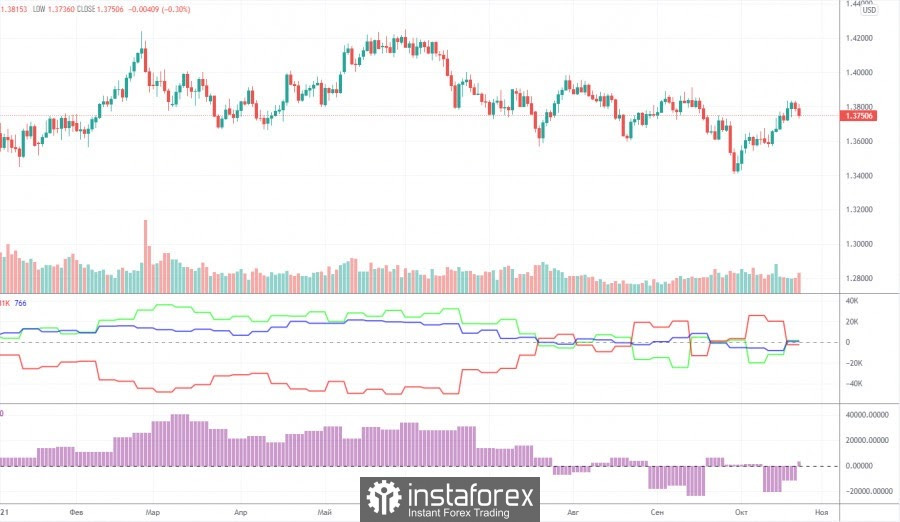
The mood of professional traders became less bearish again during the last reporting week (October 12-18). The situation with the Commitment of Traders (COT) reports is now even more ambiguous than with the technical picture. And if we compare the COT reports for the euro and the pound, then the situation becomes even stranger. Both indicators in the chart above show that large players do not have any clear, precise and understandable mood at the moment. Consequently, now it is simply impossible to make any forecasts based on COT reports. In principle, the chart above clearly shows the entire movement of the pair over the past year. It is rather difficult to call it a trend or even a trend. In the last couple of months, the mood of the big players has been constantly changing. The green and red lines of the first indicator (net positions of groups of traders "commercial" and "non-commercial") are constantly changing the direction of movement. This means that the two largest groups of traders are constantly increasing and decreasing their net positions. During the reporting week, professional traders opened 2,000 buy contracts (longs) and closed 12.5 thousand sell contracts (shorts). Thus, their net position increased by 10.5 thousand contracts. This is in line with what has been happening with the pound in recent weeks (it is rising). Nevertheless, it is impossible to make a long-term forecast, since the net position may fall already by the end of next week. We also pay attention to the fact that the green and red lines of the first indicator are not moving towards each other and are not moving away from each other. Therefore, it is also impossible to talk about any trend now.
Explanations for the chart:
Support and Resistance Levels are the levels that serve as targets when buying or selling the pair. You can place Take Profit near these levels.
Kijun-sen and Senkou Span B lines are lines of the Ichimoku indicator transferred to the hourly timeframe from the 4-hour one.
Support and resistance areas are areas from which the price has repeatedly rebounded off.
Yellow lines are trend lines, trend channels and any other technical patterns.
Indicator 1 on the COT charts is the size of the net position of each category of traders.
Indicator 2 on the COT charts is the size of the net position for the non-commercial group.
InstaForex analytical reviews will make you fully aware of market trends! Being an InstaForex client, you are provided with a large number of free services for efficient trading.

