 Stay
Stay 
Trading Conditions
Products
Tools


Here are the details of the economic calendar for November 5, 2021:
The report of the United States Department of Labor for October surprised the market in several key parameters. The report turned out to be even stronger than experts expected – the number of newly created jobs is 531 thousand against the forecast of 450 thousand. In turn, the unemployment rate declined more than expected and reached the level of 4.6%.
As a result, there is an active recovery of the US labor market.
Analysis of trading charts from November 5:
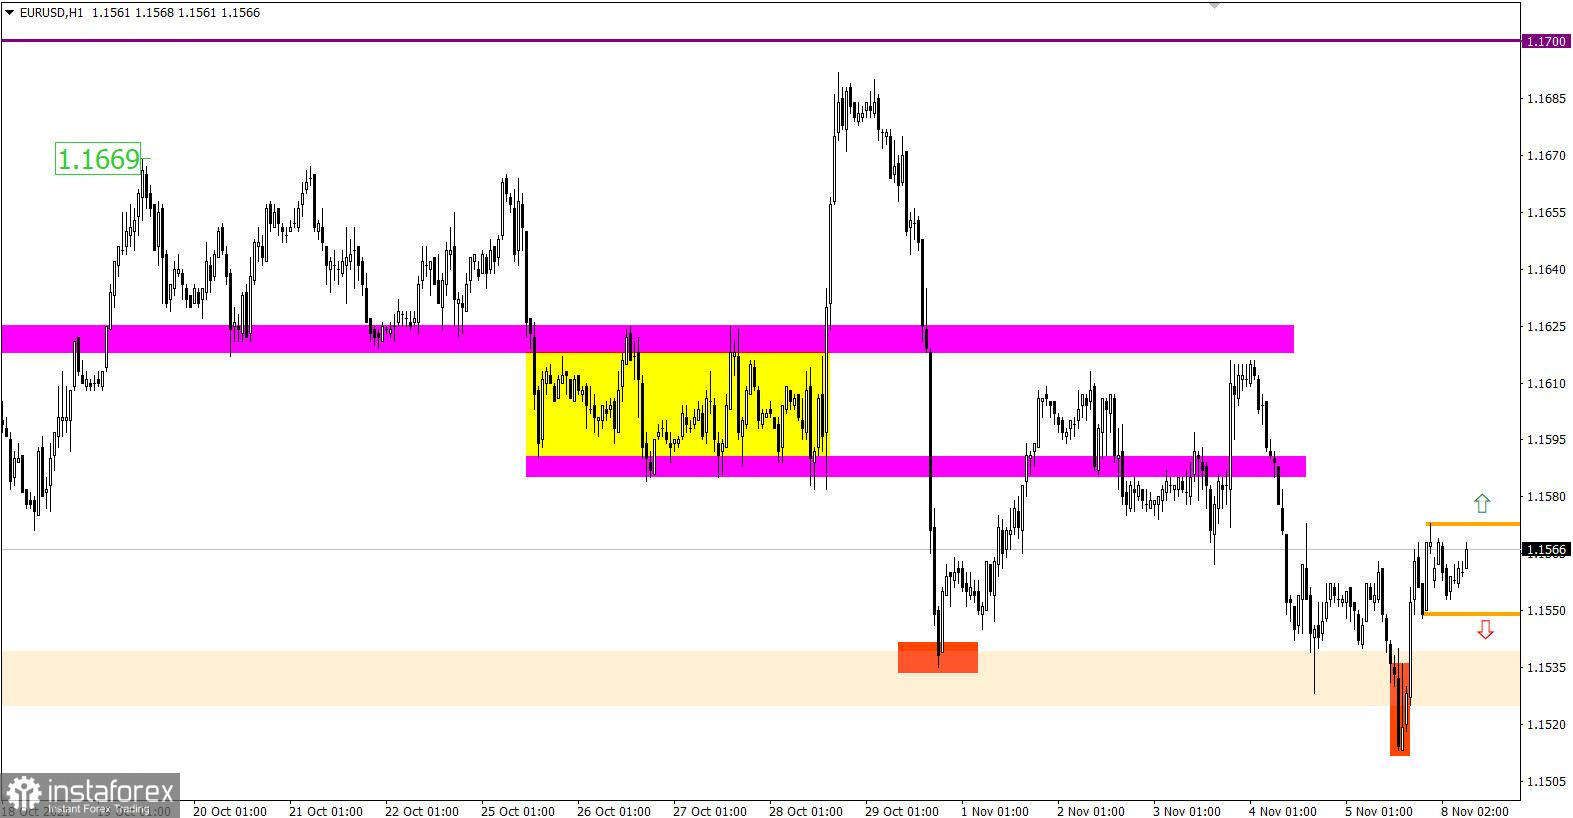
The EUR/USD pair updated the local low of 2021 last Friday, but market participants failed to stay below the support area of 1.1525/1.1535. As a result, the volume of short positions sharply decreased, which led to a technical correction.
Despite the price rebound, the decline from the beginning of June prolonged the existing cycle. This indicates the prevailing interest in dollar positions.
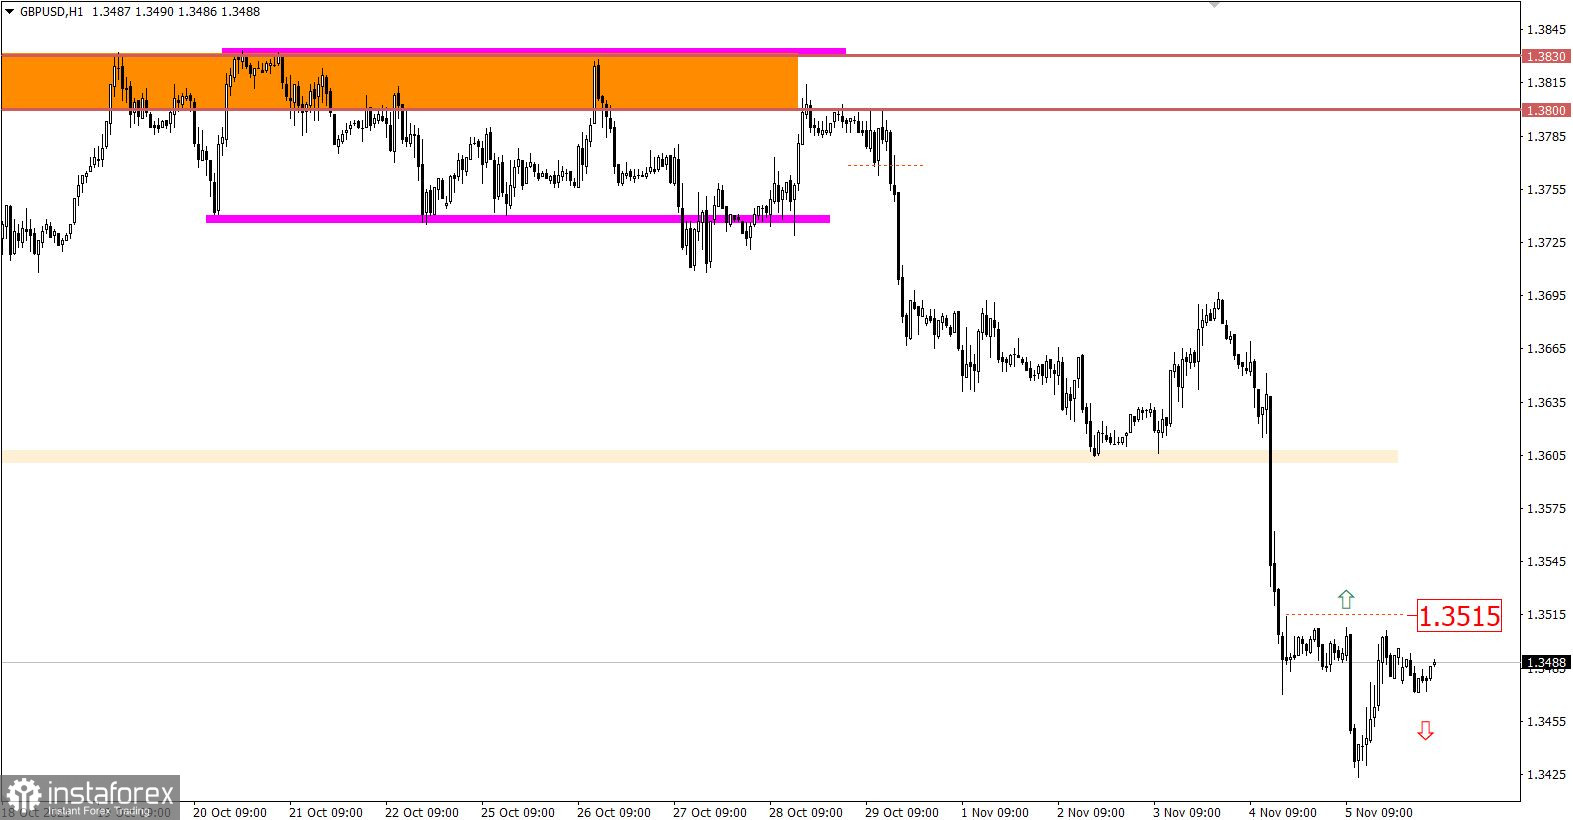
Meanwhile, the pound has lost more than 250 in value over the past week. This led to a decline towards the support level of 1.3400, where there was a natural reduction in the volume of short positions.
A slight slowdown does not cancel the downward cycle, so a subsequent decline cannot be ruled out, which will lead to a breakdown of the support level.

November 8 economic calendar:
Monday is traditionally accompanied by an absolutely empty macroeconomic calendar. Therefore, special attention is paid to the information flow and technical analysis.
Trading plan for EUR/USD on November 8:
The euro returned to the level of 1.1570 during the correction, where there was a stagnation in the range of 1.1550/1.1570.
It can be assumed that the price movement in the range of 1.1550/1.1570 will remain on the market for some time. This will lead to the accumulation of trading forces and, as a result, to downward momentum.
If expectations coincide, the breakdown method is considered the most appropriate trading tactic.
Trading recommendations
Buy positions will be considered after the price is kept above the level of 1.1575.
Sell positions will be considered after the price is kept below the level of 1.1545.
Trading plan for GBP/USD on November 8:
There is currently a pullback from the support area, which is replaced by stagnation. If the price is kept above the level of 1.3515, the pullback may well go into the correction stage. In this case, the pound sterling may strengthen towards the level of 1.3600.
An alternative scenario for the development of the market will be considered by traders if the stagnation drags on. This will lead to the completion of the pullback and another decline towards the support level of 1.3400.
What is reflected in the trading charts?
A candlestick chart view is graphical rectangles of white and black light, with sticks on top and bottom. When analyzing each candle in detail, you will see its characteristics of a relative period: the opening price, closing price, and maximum and minimum prices.
Horizontal levels are price coordinates, relative to which a stop or a price reversal may occur. These levels are called support and resistance in the market.
Circles and rectangles are highlighted examples where the price of the story unfolded. This color selection indicates horizontal lines that may put pressure on the quote in the future.
The up/down arrows are the reference points of the possible price direction in the future.
InstaForex analytical reviews will make you fully aware of market trends! Being an InstaForex client, you are provided with a large number of free services for efficient trading.


