 Stay
Stay 
Trading Conditions
Products
Tools


EUR/USD on 5M
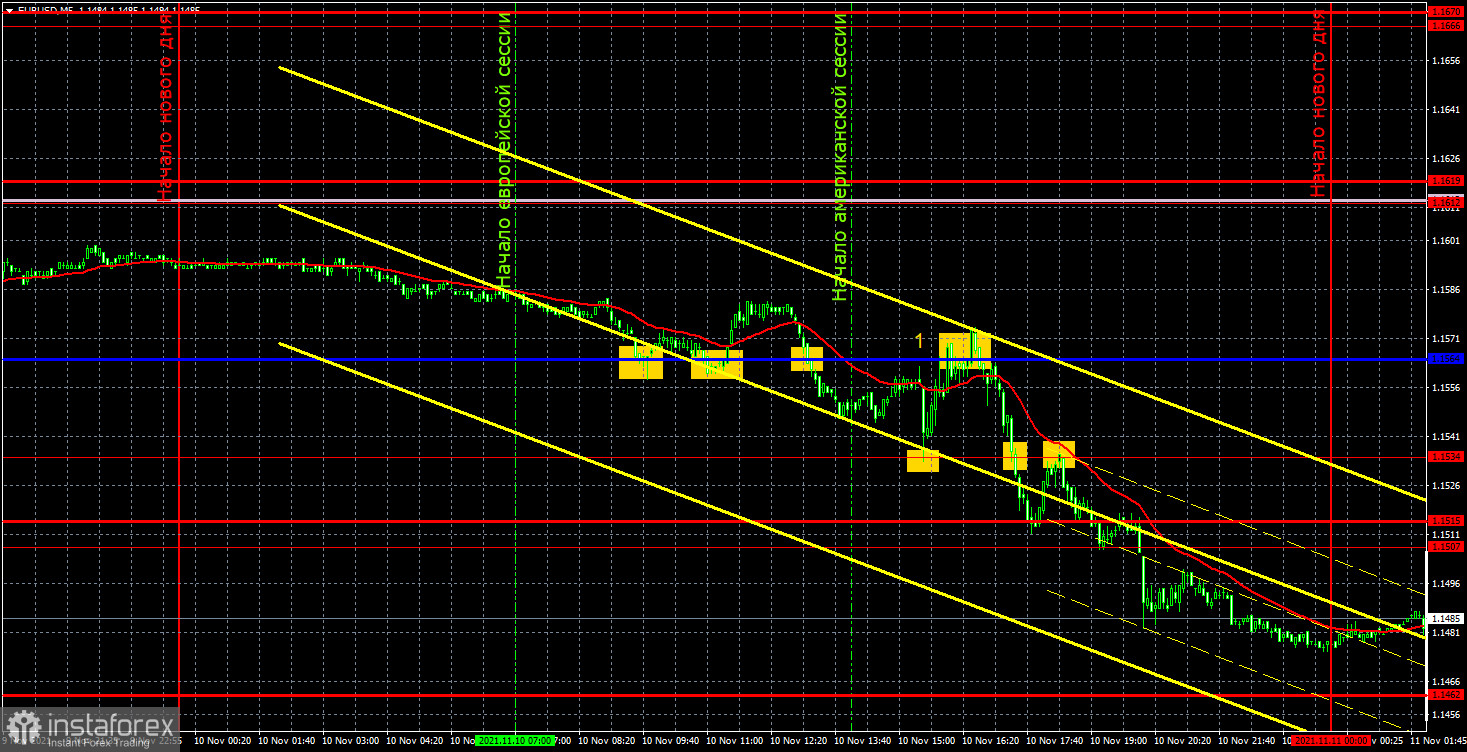
On Wednesday, the EUR/USD pair was trading more actively than the day before. The total volatility of the day amounted to 83 pips, and this is something we can analyze. The pair movements were not so smooth since the price changed its direction several times during the day and did it quite sharply. Thus, it was rather difficult to trade yesterday. Moreover, a report on US inflation published yesterday was difficult to interpret (number 1 in the picture). The CPI rose to 6.2% YoY in October. However, we warned you that the markets' reaction to this report could be mixed. To put it simply, the acceleration of inflation used to be interpreted as a sign that the QE program will soon be cut. At the same time, the US regulator has already started to limit its QE program. Besides, any acceleration of inflation is generally negative for the currency since it depreciates more quickly. It seems that the markets did not fully understand how to react to this report. At first, the US dollar rose by 25 pips, then fell by 40 pips, and after that went up by 60 pips. Such swing movements in the American trading session could result in losses, so the inflation report had to be treated with caution. Let's see what trading strategies could have been used yesterday. There were 6 trading signals formed on November 10, and 4 of them appeared near the critical line. Yesterday we wrote that Bollinger bands were signaling a flat movement on the 4-hour time frame, so the lines of the Ichimoku indicator were weak. These factors had to be taken into account when trading as the first two signals in the form of a rebound from the Kijun-sen line showed that the signals were weak. By the way, the third sell signal was also weak as the price reached the nearest target level only thanks to the inflation report. The rebound from the level of 1.1534 (the fourth signal) should not have been used either as it was formed 10 minutes after the publication of important data. The fifth critical line signal was to be ignored as well for the same reason as the first three. The last two sell signals near the level of 1.1534 should not have been followed since the price had already declined by 65 pips from the high of the day. Notably, the normal volatility range for the euro/dollar pair has recently been within 40-50 pips.
EUR/USD on 1H
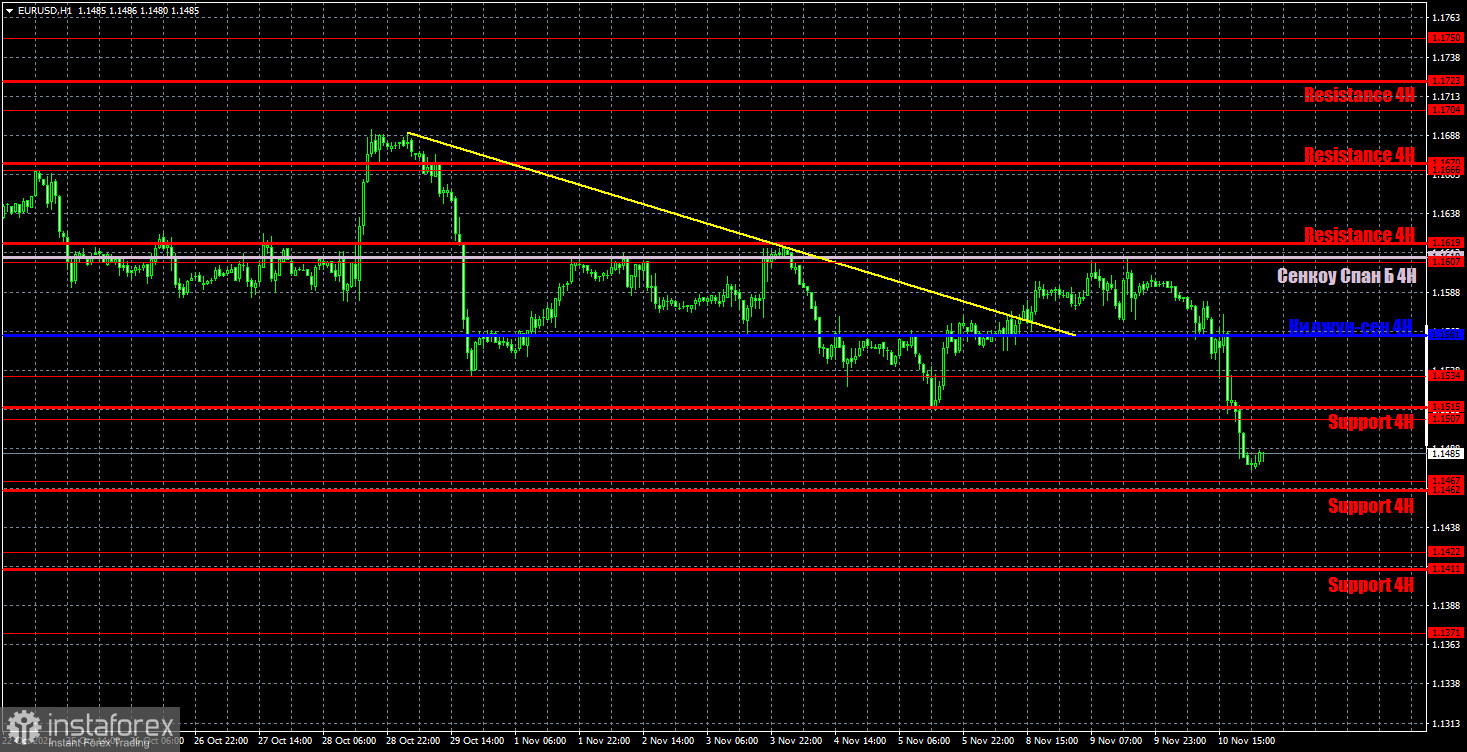
On the 1-hour time frame, the downtrend reversed very quickly. As we have already said, the trajectory of the euro/dollar pair has been very confusing at this time. It is neither a trend nor a flat movement. A few days ago, the quotes of the pair consolidated above the trend line, and yesterday they renewed their yearly lows. Thus, it makes no sense to predict anything now. On Thursday, we highlighted the following levels for trading: 1.1422, 1.1467, 1.1507, 1.1534, 1.1607, 1.1666, as well as the Senkou Span B (1.1610) and Kijun-sen (1 , 1561). The Ichimoku indicator lines can change their position during the day, which should be taken into account when looking for trading signals. Signals can come in the form of bounces and breakouts of these levels and lines. Do not forget about placing a Stop Loss to a breakeven point if the price moves 15 pips in the right direction. This will protect you against possible losses if the signal turns out to be false. On the 4-hour time frame, the Bollinger Bands indicator is still signaling a flat movement, so the signals near the Ichimoku indicator lines may be false. On November 11, there won't be any important fundamental events in the European Union and the United States. The European Commission will publish its forecast for the economy today, but this event is unlikely to be reflected in the chart of the euro/dollar pair.
Analysis of COT report
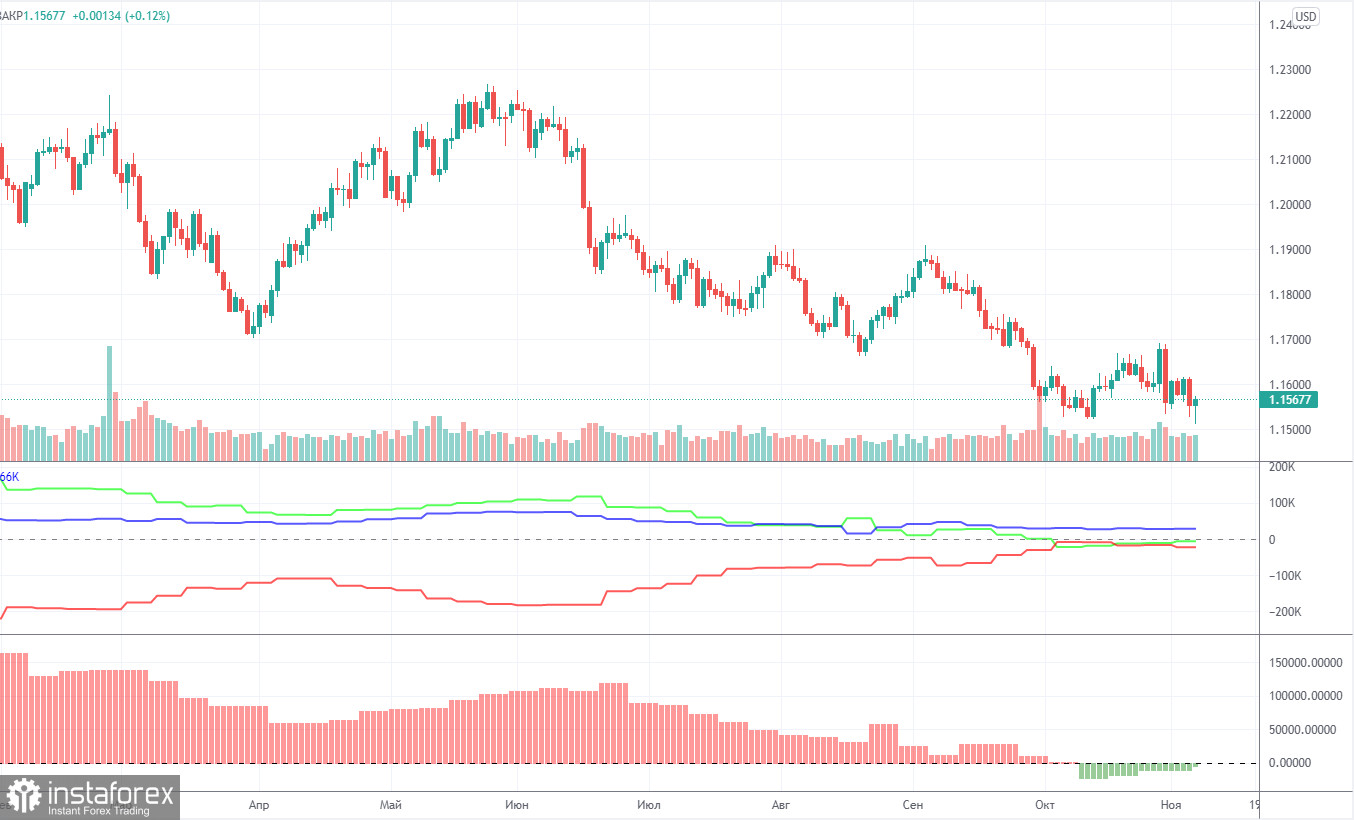
During the reporting week of October 26 - November 1, the sentiment of the non-commercial category of traders has slightly changed. That week, they closed 4,000 buy contracts and 10,500 sell contracts. Consequently, the net position of professional players increased by 6,500, which is not that much. The change in the market sentiment is best reflected by the first indicator in the illustration above. The red and green lines have been moving towards each other for a long time, and in the last couple of months they have been almost at the same level. This suggests that the previous trend is ending, and the mood of the major market players at this time is as neutral as possible. This is confirmed by the data on the total number of contracts. The non-commercial group has 195,000 buy contracts and 199,000 sell contracts. The commercial category of traders has 418,000 buy contracts and 442,000 sell contracts opened. As we can see, the numbers are very close. So, there is a chance that the pair will continue its downward movement. The uptrend is going to be completed soon, while the red and green lines (net positions of the "Commercial" and "Non-commercial" groups) began to narrow. So we can logically assume that the downward movement is still in place. Yet, this trend is not very clear and looks more like an ordinary three-wave correction.
On the chartSupport and resistance levels are the levels that serve as targets when buying or selling the pair. You can place Take Profit near these levels.
The Kijun-sen and Senkou Span B lines are the Ichimoku indicator lines transferred to the 1-hour time frame from the 4-hour time frame.
Support and resistance areas are areas from which the price has repeatedly bounced off.
Yellow lines are trend lines, trend channels and any other technical patterns.
Indicator 1 on the COT chart reflects the size of the net position of each category of traders.
Indicator 2 on the COT chart reflects the size of the net position for the mon-commercial category of traders.
InstaForex analytical reviews will make you fully aware of market trends! Being an InstaForex client, you are provided with a large number of free services for efficient trading.


