 Stay
Stay 
Trading Conditions
Products
Tools


4-hour timeframe
Technical details:
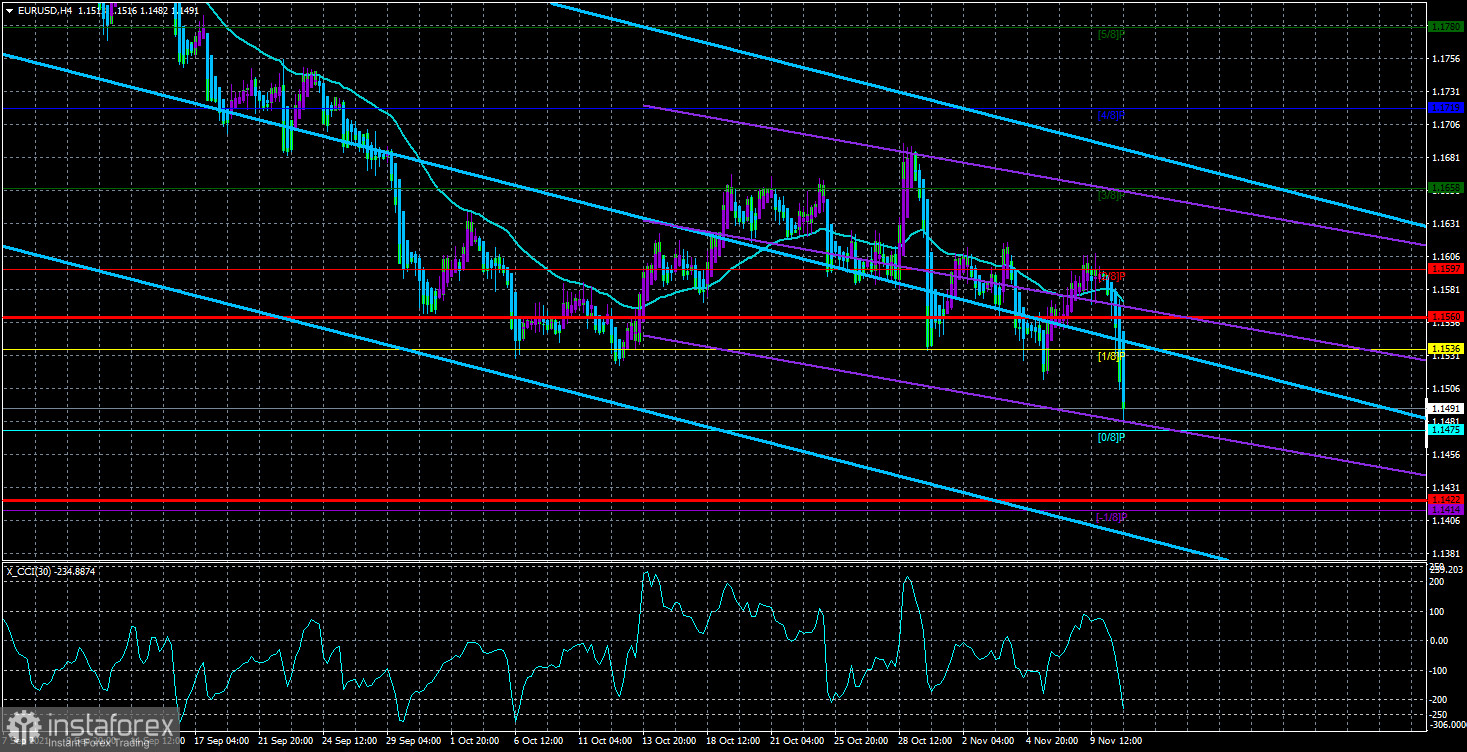
Higher linear regression channel: direction - downward.
Lower linear regression channel: direction - downward.
Moving average (20; smoothed) - downward.
The EUR/USD currency pair collapsed on Wednesday, which was very unlike it. In the last few months, the volatility of the euro/dollar has averaged about 40-50 points per day. Yesterday, the pair showed volatility equal to 113 points, although a single report on inflation in the United States was published. However, this report, given its significance, could provoke such a reaction in the markets. However, inflation is slightly lower. In the meantime, it should be said that thanks to yesterday's movement, the pair finally left the 1.1536-1.1658 side channel, which it had been for more than a month. Thus, at the moment, the downward movement has resumed, and the new upward trend is again postponed indefinitely. The US currency finds the strength to resume falling every time, but still overcoming important levels. At the moment, the quotes of the European currency have fallen on the daily timeframe to the 50.0% Fibonacci level, which we talked about in our last weekly reviews. Since the movement on the 4-hour timeframe remains extremely unstable and ugly, it may be better now to analyze the daily TF, where the price at least does not change the direction of movement every few candles. According to the Ichimoku indicator on the daily chart, the pair confidently maintains a downward trend and has not yet been able to gain a foothold above the Ichimoku cloud. But on the current TF, it regularly overcomes the moving, which is only confusing.
"Strong inflation is a temporary phenomenon," they said.
American inflation, meanwhile, continues to rise. In October, its value was already 6.2% y/y, which is much higher than forecasts. Core inflation also increased (excluding food and energy prices) to 4.6% y/y. Thus, the 30-year-old anti-record is broken! There has not been such high inflation in the United States for three decades. However, what is there to be surprised about? Over the past year, we have repeatedly written that all these trillions of dollars that are created in the accounts of the Fed and injected into the economy through the redemption of treasury bonds in the government will not pass without a trace. As a result, the States faced the highest inflation, which it is unclear how to stop now. The fact that the American economy is now completely out of sync is also no secret to anyone. Financial markets are inflated like "soap bubbles." There is an overabundance of money in the economy, American consumers are buying up goods after the pandemic at any price, manufacturers cannot meet demand, but are forced to raise prices due to rising prices for raw materials, fuel, and electricity. In general, most likely, in the coming years, the whole world will suffer from inflation and price increases (although formally it is the same thing). However, it should be understood that goods will increase in value because the price of raw materials on international markets is rising, oil is becoming more expensive, and money is also depreciating. Thus, even if inflation is low in a particular country, prices will still rise. The main thing is that the whole world does not face a new financial crisis. This can happen if one or more "bubbles" burst. And now the US stock market, the real estate market in China, and the cryptocurrency market can burst. In general, it seems that a huge shaft of snow is already ready for its flight down. It remains only to find out where the shot will strike, which will launch an avalanche? In principle, there is no point even guessing where and when this will happen. The world faces crises and collapses from time to time, and usually, this happens once every 5-10 years. Thus, there is no reason to say that something like this will not happen next year. The US dollar is strengthening for now, but again - too many factors should be taken into account now to predict its movement.
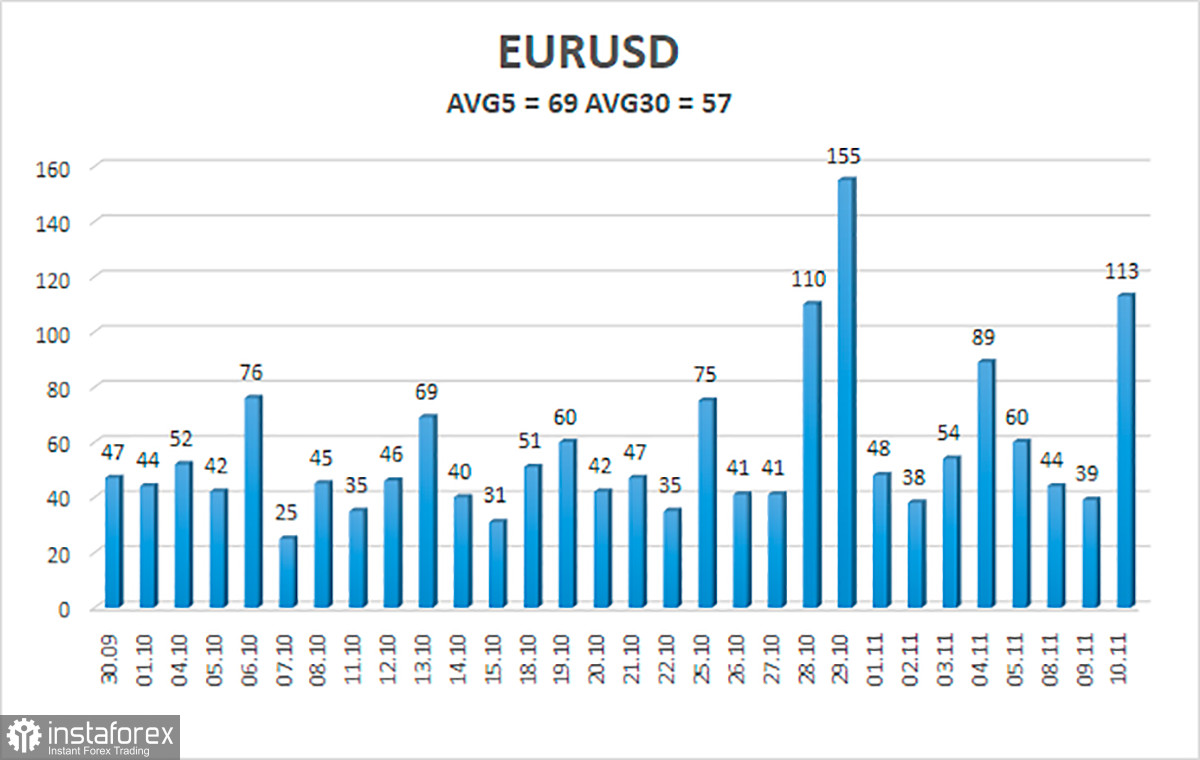
The volatility of the euro/dollar currency pair as of November 11 is 69 points and is characterized as "average". Thus, we expect the pair to move today between the levels of 1.1422 and 1.1560. A reversal of the Heiken Ashi indicator upwards will signal a new round of upward movement.
Nearest support levels:
S1 – 1.1475
S2 – 1.1414
S3 – 1.1353
Nearest resistance levels:
R1 – 1.1536
R2 – 1.1597
R3 – 1.1658
Trading recommendations:
The EUR/USD pair has consolidated back below the moving average line. Thus, today, it is necessary to stay in short positions with targets of 1.1475 and 1.1422 until the Heiken Ashi indicator turns upwards. Purchases of the pair should be considered if the price is fixed back above the moving average, with a target of 1.1658. However, it should be taken into account that reversals now occur very often, and yesterday's strong movement was provoked by important statistics. It is unlikely that it will be like this every day now.
Explanations to the illustrations:
Linear regression channels - help determine the current trend. If both are directed in the same direction, then the trend is strong now.
Moving average line (settings 20.0, smoothed) - determines the short-term trend and the direction in which trading should be conducted now.
Murray levels - target levels for movements and corrections.
Volatility levels (red lines) - the likely price channel in which the pair will spend the next day, based on current volatility indicators.
CCI indicator - its entry into the oversold area (below -250) or into the overbought area (above +250) means that a trend reversal in the opposite direction is approaching.
InstaForex analytical reviews will make you fully aware of market trends! Being an InstaForex client, you are provided with a large number of free services for efficient trading.

