 Stay
Stay 
Trading Conditions
Products
Tools


Trend analysis (Fig. 1)
Today, the price from the level of 1.3485 (closing of yesterday's daily candle) will decline to the target of 1.3461 – the pullback level of 23.6% (blue dotted line). After testing this level, the continuation of the upward trend can be expected to the target of 1.3495 – the upper fractal (blue dashed line).
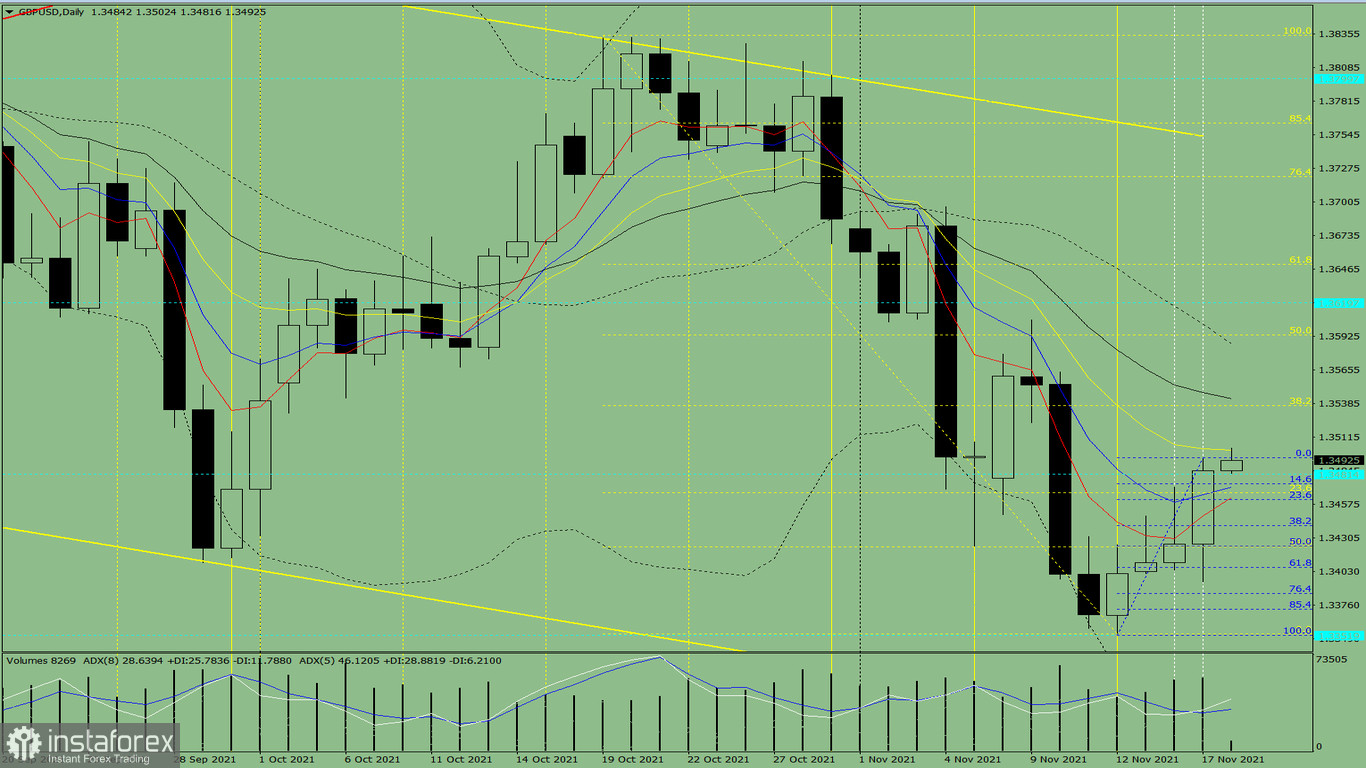
Figure 1 (daily chart)
Comprehensive analysis:
General conclusion:
The price from the level of 1.3485 (closing of yesterday's daily candle) is expected to fall to the target of 1.3461 – the pullback level of 23.6% (blue dotted line). Once tested, it may further rise to the target of 1.3495 – the upper fractal (blue dashed line).
As an alternative, the price from the level of 1.3485 (closing of yesterday's daily candle) will decline to the target of 1.3439 – the pullback level of 38.2% (blue dotted line). After testing it, the downward trend may resume to the target of 1.3423 – the pullback level of 50.0% (blue dotted line), and only then it is possible to move upward again.
InstaForex analytical reviews will make you fully aware of market trends! Being an InstaForex client, you are provided with a large number of free services for efficient trading.


