 Stay
Stay 
Trading Conditions
Products
Tools


Yesterday, America's weekly data on applications for unemployment benefits were published, where their volume declined.
Details of statistics:
The volume of initial applications for benefits decreased from 269 thousand to 268 thousand.
The volume of repeated applications for benefits decreased from 2,209 thousand up to 2,080 thousand.
Applications for unemployment benefits reflect the number of currently unemployed citizens and those receiving unemployment benefits. This indicator is considered to be the state of the labor market, where the growth of the indicator negatively affects the level of consumption and economic growth. The reduction of applications for benefits has a positive effect on the labor market.
At first glance, everything is great, but the previous data were revised in favor of growth: 267 thousand ---> 269 thousand and 2,160 thousand ---> 2,209 thousand. At the same time, they predicted a more intensive decline in initial applications to 260 thousand.
As a result, the US dollar practically did not react to the overall decline in the indicator.
Analysis of trading charts from November 18:
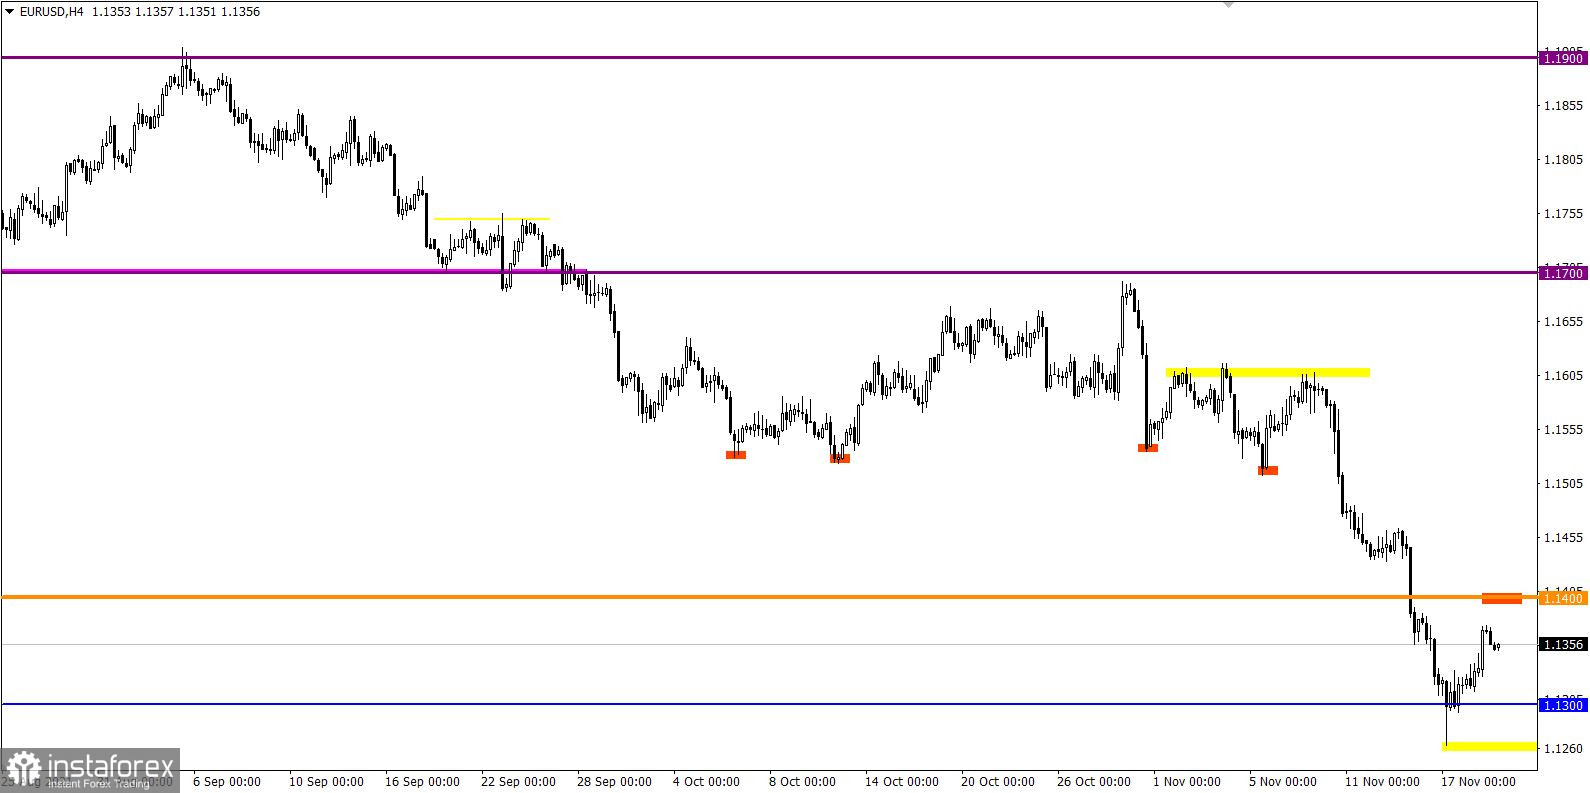
The euro's high level of oversold positively affected the volume of long positions against the US dollar. As a result, there was a corrective move towards the resistance level of 1.1400.
Despite the local change of direction in the market, a downward mood prevails as before. The current pullback may well play into the hands of sellers in terms of regrouping trading forces.
To put it simply, the Euro currency was overheated due to a sharp decline. During the pullback period, the oversold status will be removed, where sellers will return to the market with renewed vigor.
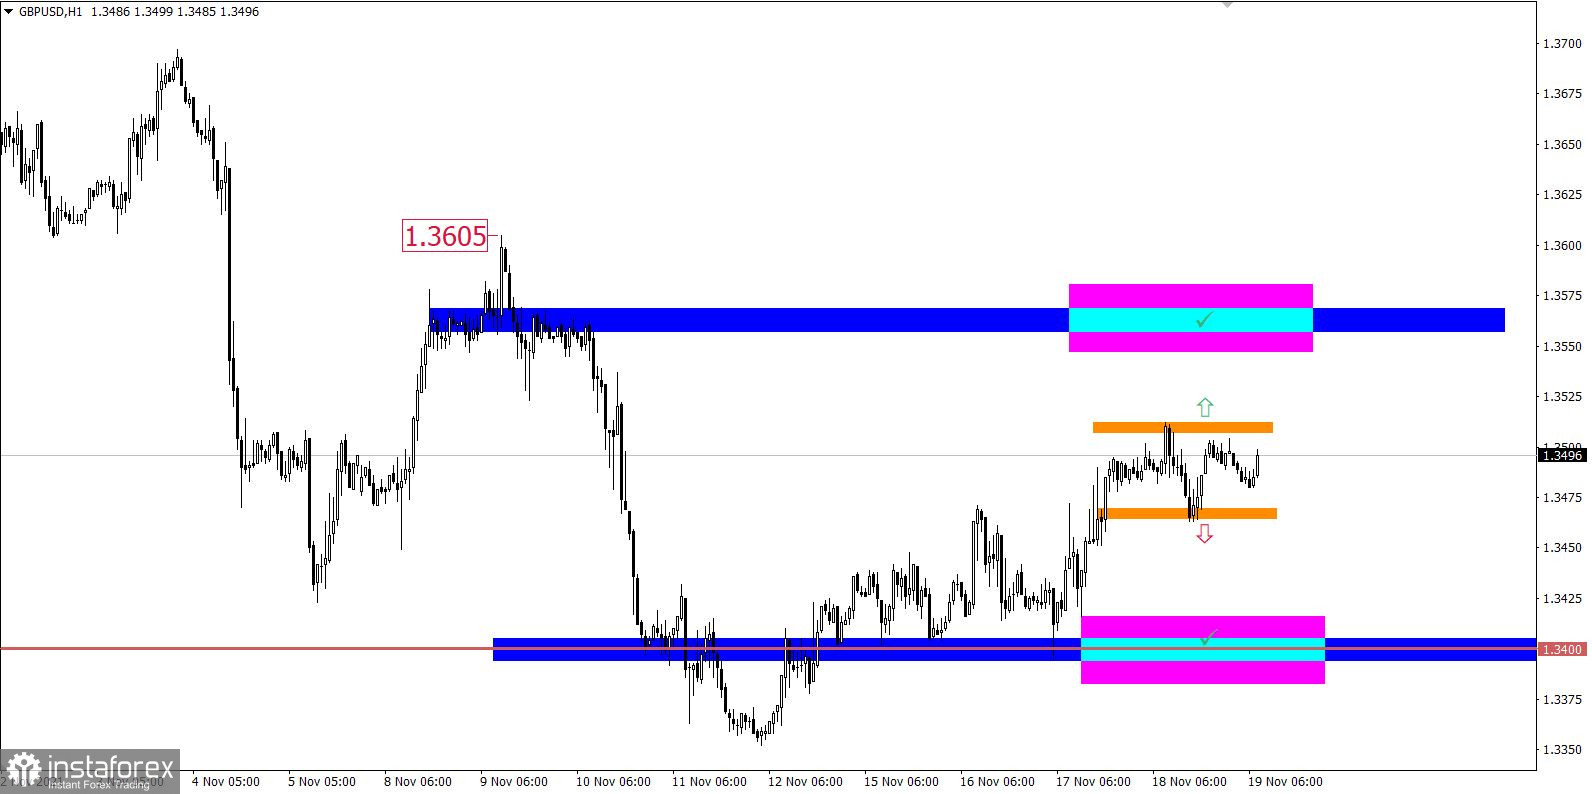
The GBP/USD pair slowed down the corrective course within the level of 1.3512. The ascending cycle was replaced by a side channel within the borders of 1.3465/1.3510.
An oversold market is a situation where prices have dropped too low and quickly. In this case, we are talking about the euro, which has lost more than 300 points in value in a short period of time.
Long positions or Long means buy positions.

Britain's retail sales data was released today at 7:00 Universal time, the rate of decline of which remained at the level of -1.3%. On the one hand, the data is bad, but on the other, the decline was forecast to accelerate to -2.0%.
The pound sterling did not react to the statistics in any way.
Trading plan for EUR/USD on November 19:
The resistance level of 1.1400 stands in the way of buyers, relative to which it is possible to reduce the volume of long positions. This may lead to a resumption of the downward trend.
It can be assumed that the price movement in the sideways range will remain on the market for some time. This will lead to the accumulation of trading forces and, as a result, a downward momentum.
If expectations coincide, the most appropriate trading tactic is considered to be the method of breaking through one or another border of the established range.
Trading recommendations:
Buy positions should be considered after holding the price above the level of 1.3515.
Sell positions should be considered after holding the price below the level of 1.3460.
What is reflected in the trading charts?
A candlestick chart view is graphical rectangles of white and black light, with sticks on top and bottom. When analyzing each candle in detail, you will see its characteristics of a relative period: the opening price, closing price, and maximum and minimum prices.
Horizontal levels are price coordinates, relative to which a stop or a price reversal may occur. These levels are called support and resistance in the market.
Circles and rectangles are highlighted examples where the price of the story unfolded. This color selection indicates horizontal lines that may put pressure on the quote in the future.
The up/down arrows are the reference points of the possible price direction in the future.
InstaForex analytical reviews will make you fully aware of market trends! Being an InstaForex client, you are provided with a large number of free services for efficient trading.


