 Stay
Stay 
Trading Conditions
Products
Tools


Yesterday, US data on home sales in the secondary market were published. It was expected that their volumes would decrease by 1.0%, but in the end, they recorded an acceleration of 0.8%. The divergence of expectations stimulated speculators to increase the volume of dollar positions.
Analysis of trading charts from November 22:
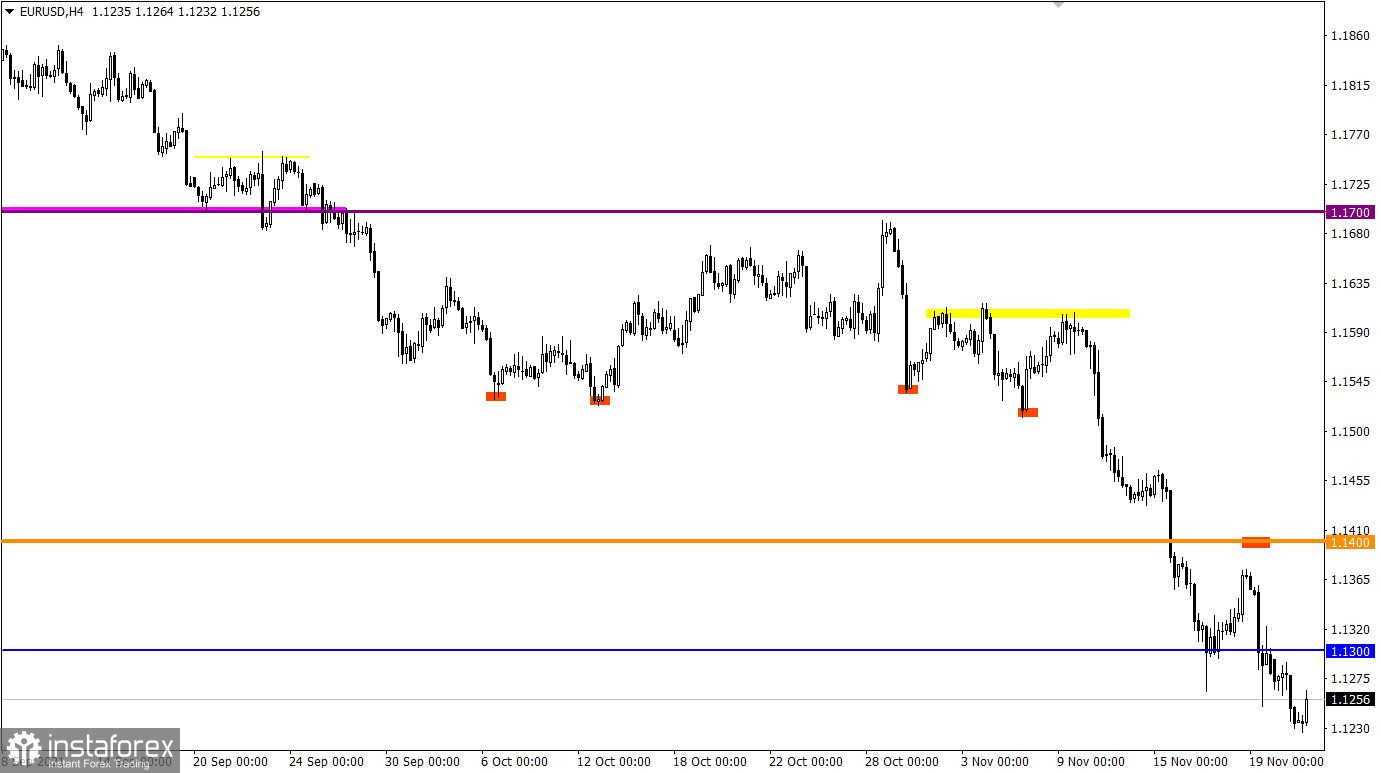
The EUR/USD pair has updated this year's local low in the process of building a downward trend. As a result, the quote dropped towards the level of 1.1225, while not reducing the volume of short positions.
The downward trend from the beginning of June is considered the main one in the market, which leads to the restoration of trade interests to the US dollar.
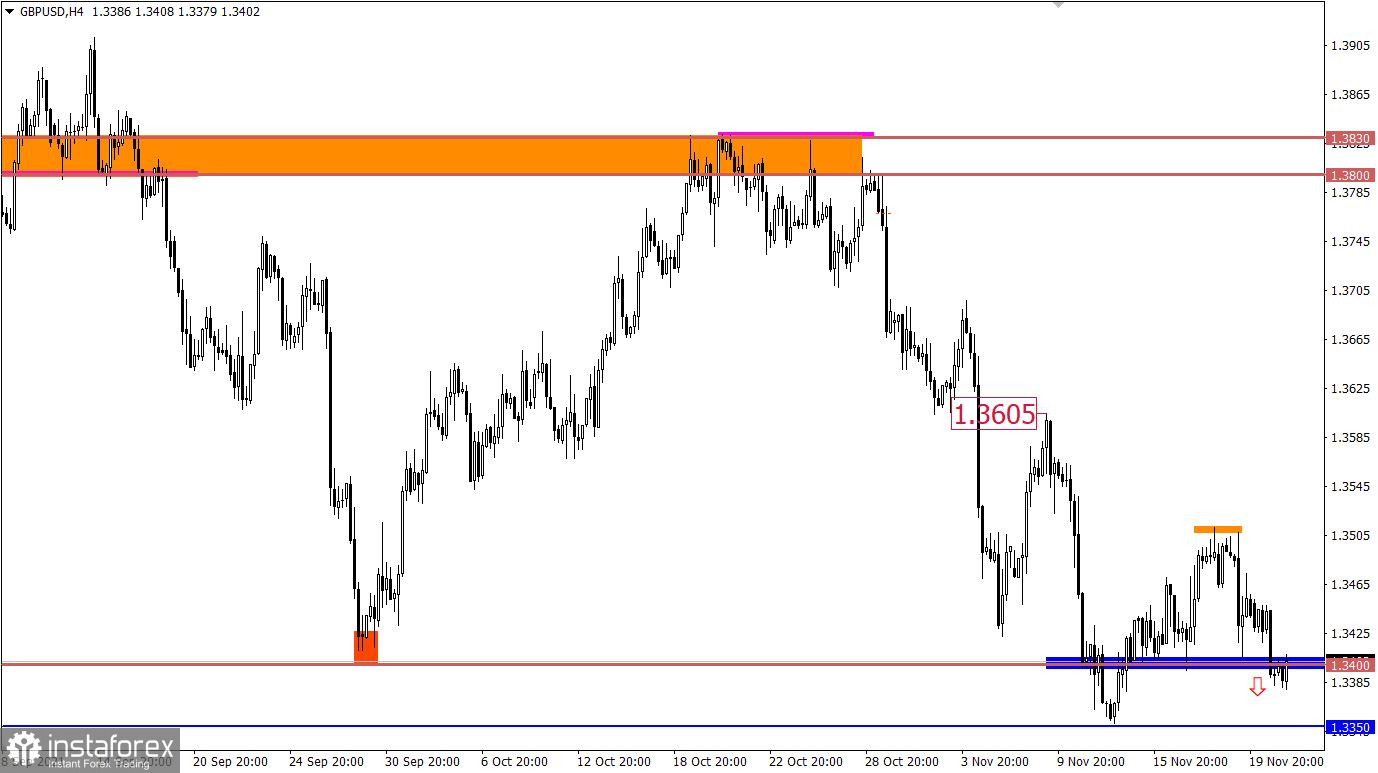
The GBP/USD pair resumed its downward course after a slight pullback, which led to the price holding below the support level of 1.3400. In comparison with the EUR/USD currency pair, the pound sterling has a good chance of further weakening, since the status of overstatement is still not fixed in the market.
The Euro currency may continue to decline today. The preliminary assessment of business activity indices will be published at 9:00 Universal time, which may decrease according to experts' expectations.
Here, the index of business activity in the manufacturing sector should fall from 58.3 to 57.5 points. In the service sector, the index is expected to decline from 54.6 to 54.0 points. The composite index of business activity may also do so from 54.2 to 53.7 points.
The decline in indices is not a favorable condition for the growth of the euro.
At 9:30 Universal time, similar data will be published in the UK, where a decline in indices is predicted.
The index in the manufacturing sector may decline from 57.8 to 56.3 points, and from 59.1 to 54.6 points in the service sector. As a result, the composite index will plunge from 57.8 to 54.1 points.
As you may have guessed, this is a negative factor for the pound.
The United States will report similar indices at 14:45 Universal time, where it is forecast to rise.
Here, the index of business activity in the manufacturing sector is forecasted to rise from 58.4 to 59.0 points. As for the service sector, the index should grow from 58.7 to 59.0 points.
This is a positive factor that can strengthen the position of the US dollar.
Trading plan for EUR/USD on November 23:
The subsequent weakening of the euro is not excluded given the high hype for short positions. In the future, it is possible to decline towards a variable pivot point of 1.1160.
It should be noted that pullbacks and corrections will occur from time to time towards the downward development. This is the normal behavior of the price in the market.
Stable price retention below the level of 1.3400 will eventually lead to a subsequent decline towards the local low (1.1350) on November 12. This pivot point will be broken by speculators in the future.
A candlestick chart view is graphical rectangles of white and black light, with sticks on top and bottom. When analyzing each candle in detail, you will see its characteristics of a relative period: the opening price, closing price, and maximum and minimum prices.
Horizontal levels are price coordinates, relative to which a stop or a price reversal may occur. These levels are called support and resistance in the market.
Circles and rectangles are highlighted examples where the price of the story unfolded. This color selection indicates horizontal lines that may put pressure on the quote in the future.
The up/down arrows are the reference points of the possible price direction in the future.
InstaForex analytical reviews will make you fully aware of market trends! Being an InstaForex client, you are provided with a large number of free services for efficient trading.


