 Stay
Stay 
Trading Conditions
Products
Tools


The negative indicator for durable goods orders did not hinder the U.S. dollar. The data on orders came out worse than expected, declining by 0.5% in the period of October, which forecasts expected to grow by 0.3%.
At the same time, United States unemployment claims declined significantly in volume.
Details of statistics:
Initial claims for benefits decreased from 270,000 to 199,000.
Continuing claims for benefits decreased from 2.1 million to 2 million.
Finally, the published data on new home sales in the United States saw an increase of 2% in October, which forecasts expected to decline by 0.4%.
As a result, indicators on the labor market and new home sales overcame the negative side of orders for durable goods. The U.S. dollar has moved to strengthen.
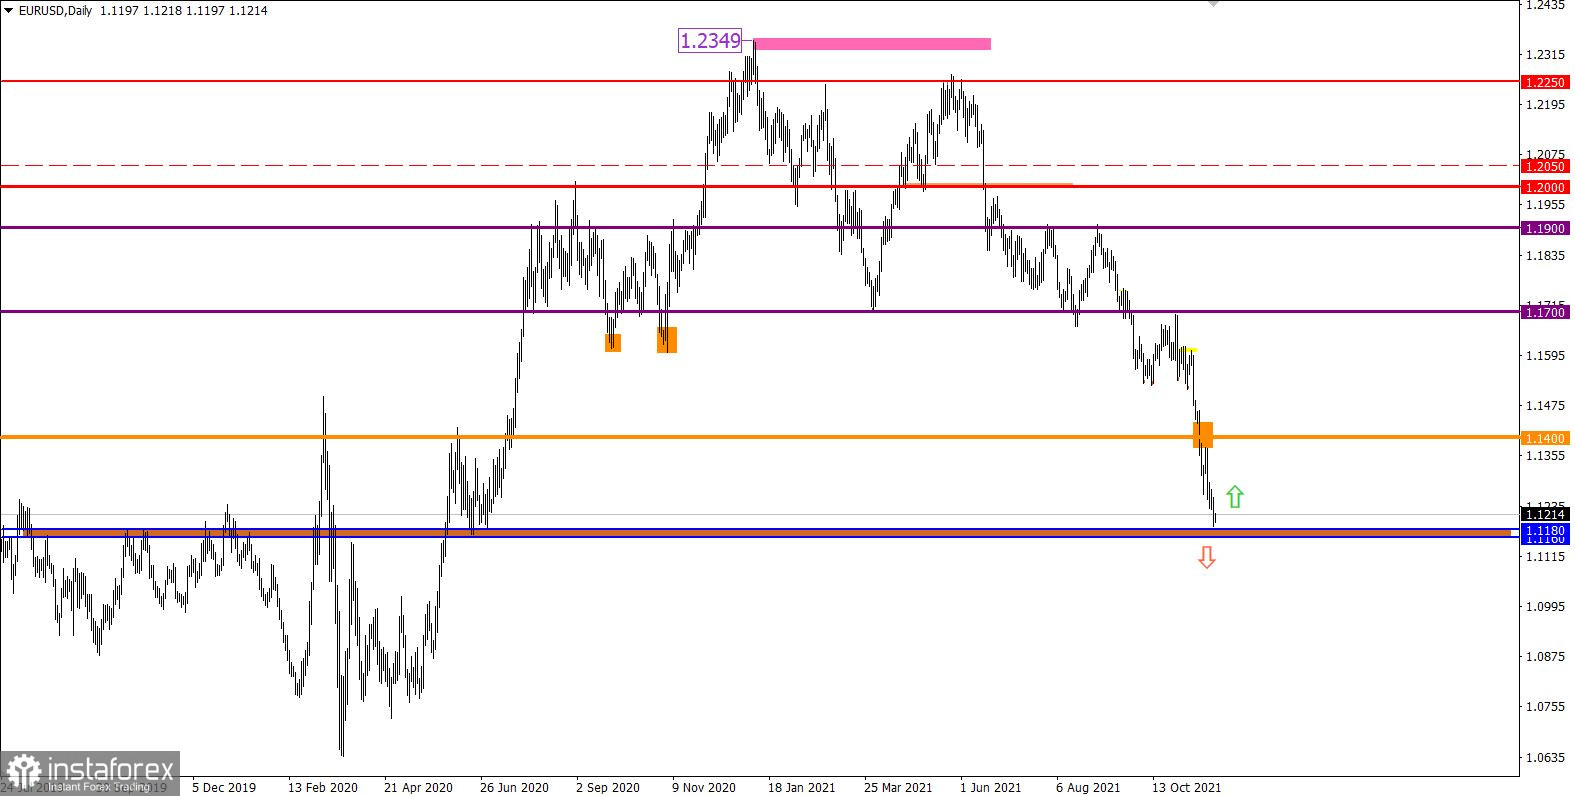
After a short stagnation in the range of 1.1225 / 1.1275, the EURUSD currency pair broke through its lower border. As a result, the downward trend cycle was prolonged, which strengthened short positions in the market.
The chart of the daily period shows an inertial course, where the euro weakened by 3.5% in two weeks. Such a large-scale price change in a short period of time signals that the asset is oversold, which can lead to a technical correction.
The trading plan of November 24 considered the tactics of breaking one or another boundary of the established range of 1.1225 / 1.1275. As a result, a sell position was opened, which brought profit.
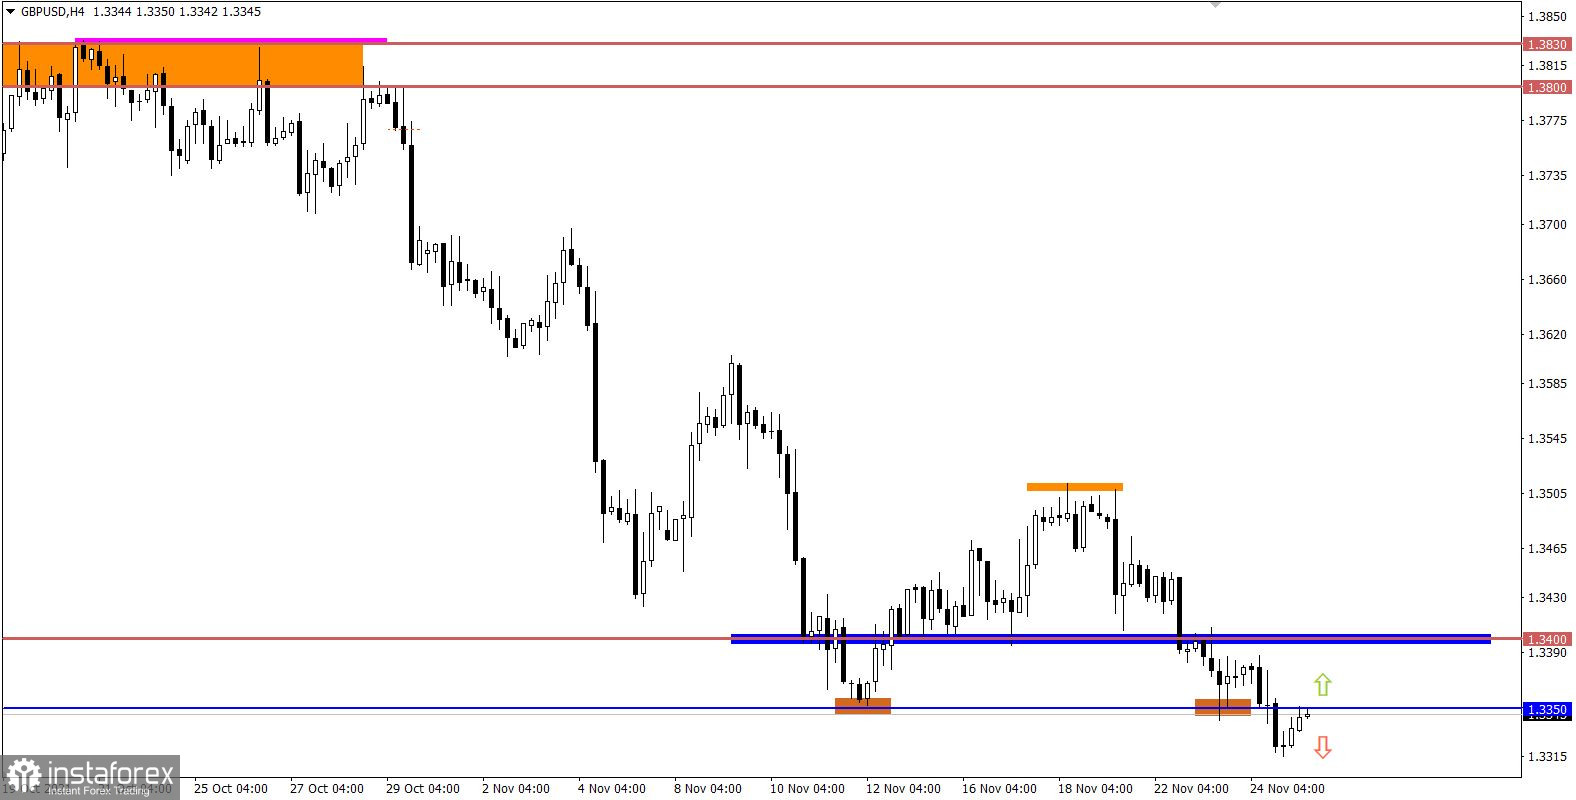
The support level of 1.3350 for the GBPUSD pair was successfully broken by speculators. This step led to the subsequent construction of a downward trend. Unlike the EURUSD pair, the British pound is not so much oversold yet. Looking ahead, everything is just beginning for sellers.
The trading plan of November 24 considered the possibility of entering a sell position at the time of holding the price below the support level of 1.3350.

Today is a non-working day in the United States due to Thanksgiving, and in Europe and Britain, the macroeconomic calendar is completely empty, so the market will stand still or show low activity.
Taking into account the scale of the decline and the absence of a corrective move, we can assume a temporary slowdown in the downward cycle. This will lead to price stagnation or a 100-point correction.
The price area 1.1160 / 1.1180 serves as a pivot point on the path of sellers.
It can be assumed that traders are in the stage of price fiction relative to the level of 1.3350, where the breakout-rollback pattern was formed. Stable price retention below 1.3350 increases sellers' chances of a subsequent decline in the pound sterling.
An alternative scenario will be considered by traders in the event of a correction stage. A buy signal will appear from the market when the price holds above 1.3360 in a four-hour period.
A candlestick chart is represented by white and black graphic rectangles with lines at the top and bottom. With a detailed analysis of each individual candle, you can see its characteristics relative to a particular time period: open price, close price, maximum and minimum prices.
Horizontal levels are price coordinates, relative to which a stop or price reversal may occur. In the market, these levels are called support and resistance.
Circles and rectangles are highlighted examples where the price of history has reversed. This highlighting in color indicates horizontal lines that may put pressure on the quote in the future.
The up/down arrows are indications of the possible direction of the price in the future.
InstaForex analytical reviews will make you fully aware of market trends! Being an InstaForex client, you are provided with a large number of free services for efficient trading.


