 Stay
Stay 
Trading Conditions
Products
Tools


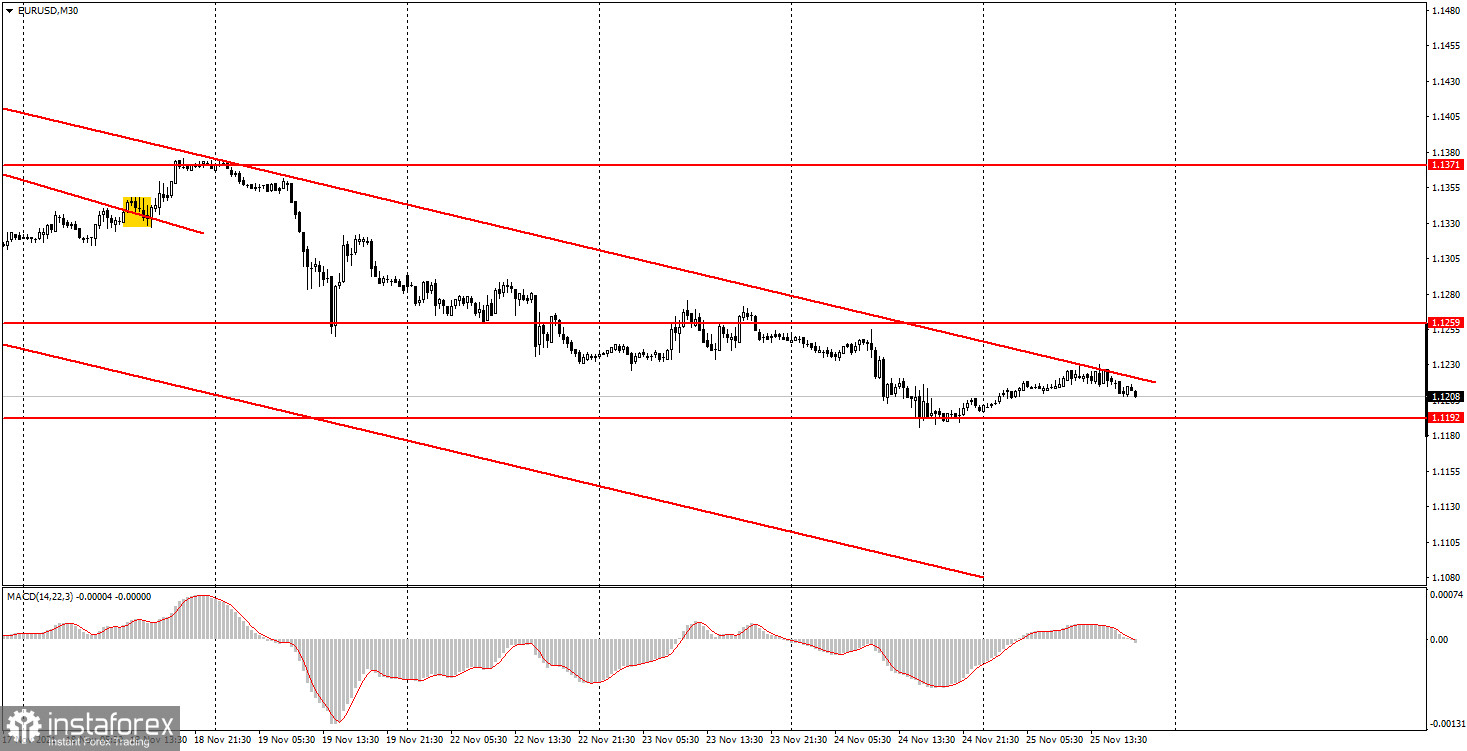
EUR/USD was mainly flat on Thursday, which was clearly seen on any time frame. The daily volatility of the pair was about 30 pips. So, it was a relatively calm day in the market. In terms of macroeconomic statistics, the calendar was completely empty both in the United States and the European Union. The same goes for fundamentals: ECB President Christine Lagarde's only speech, who speaks almost every day in recent weeks, could hardly trigger market jitters. Judging from all the above, the pair is likely to remain bearish on Friday. However, the quote might leave the descending channel, which would mean the end of the downtrend. Anyway, the price bounced from the upper line of this channel, generating a sell signal. A similar signal was also produced on the M5 chart.
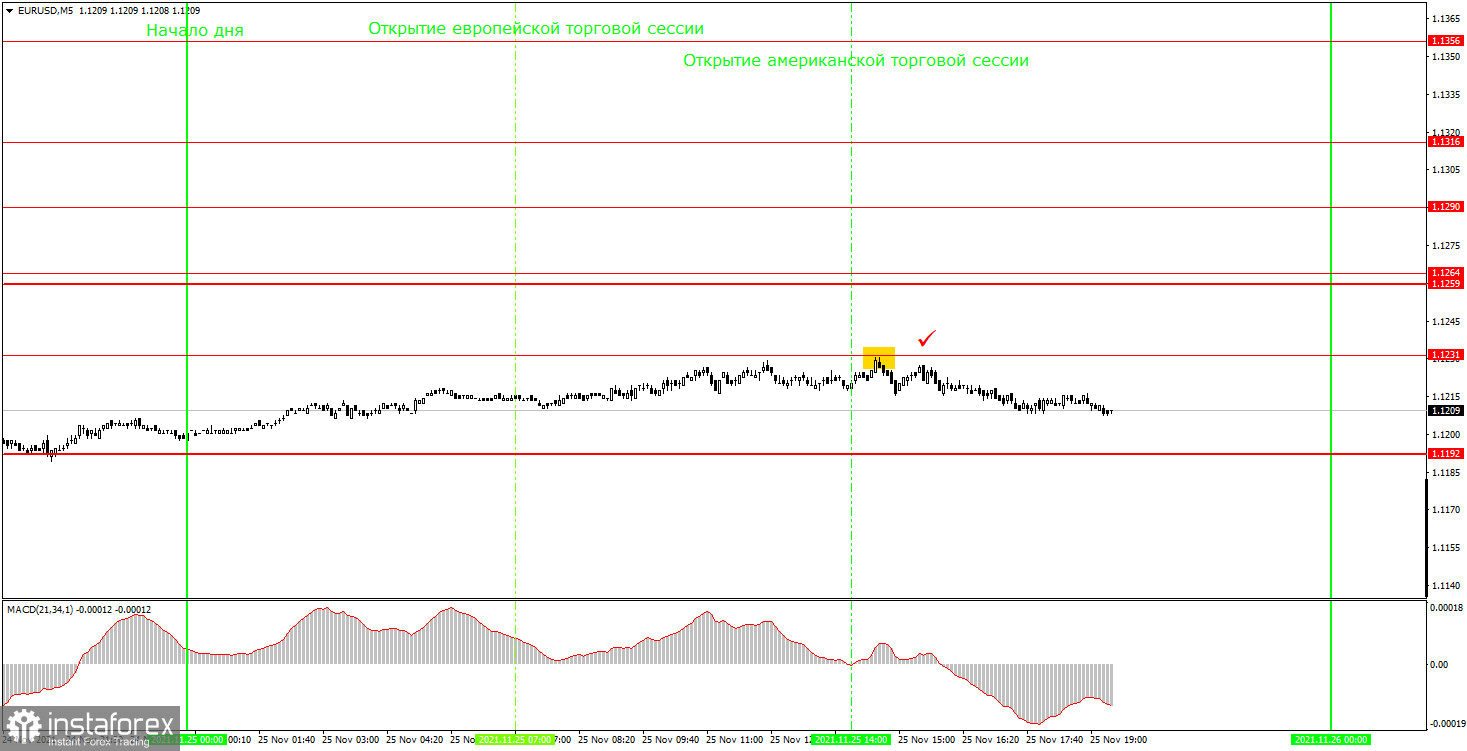
According to the M5 chart, the quote rose by 20 pips from its low to its high during the European and North American sessions. Nevertheless, it managed to form a sell signal within the day. As it was not a false signal, traders did not incur losses. It is about a bounce from 1.1231 at the beginning of the North American session. Short positions opened there brought a 15 pips profit. Yet, the price failed to test the nearer target and trades were to be closed manually in the evening. No more signals were generated that day.
On the M30 chart, a clear downtrend is seen. In other words, the pair is likely to extend its downward movement. So, short positions could be opened until consolidation above the channel. On the M5 chart, the key levels on November 26 are 1.1192, 1.1231, 1.1259 – 1.1264. There are simply no other levels below because the price has not been there for about a year. A Take-profit order is to be set at a distance of 30-40 pips. A Stop-loss order is to be placed at the breakeven point when the quote passes 15 points in the required direction. On the M5 chart, the target is seen at the nearest level if it is not located too close or too far. Otherwise, you should take it from there. On Friday, ECB's Christine Lagarde will again deliver a speech and this is going to be the only event to attract market participants' attention. No important events are scheduled in the US. For that reason, the pair is not expected to show high volatility or any sharp movement on Friday.
1) The strength of a signal is calculated by the time it took a signal to form (bounce or break through the level). The less time it takes, the stronger is the signal.
2) If two or more trades are opened near a certain level based on false signals (which did not trigger a Take Profit order or a test of the nearest target level), then all subsequent signals from this level should be ignored.
3) Being flat, any pair might form a lot of false signals or non at all. In any case, when seeing the first signs of a flat, trading should be stopped.
4) Trades are opened within the time period between the opening of the European session and the middle of the North American session when all trades should be closed manually.
5) On the M30 chart, trading should be carried out based on signals from the MACD indicator only if there is good volatility or a trend confirmed by a trend line or a channel.
6) If two levels are located close to one another (from 5 to 15 pips), they should be considered as the area of support or resistance.
Support and resistance are target levels when buying or selling a pair. A Take-profit order could be set near them.
Red lines are channels or trend lines that display the current trend and show in what direction it is preferable to trade now.
MACD (14, 22, 3) - a histogram and a signal line, the crossing of which produces a signal to enter the market. It should be used in combination with trend patterns (channels, trend lines).
Important speeches and reports (always contained in the calendar) can greatly influence the movement of a currency pair. Therefore, at the time of publication, market players should trade very cautiously or exit the market to avoid a reversal.
Beginners should remember that not every trade will be profitable. An effective trading strategy and money management are the keys to success in long-term trading.
InstaForex analytical reviews will make you fully aware of market trends! Being an InstaForex client, you are provided with a large number of free services for efficient trading.


