 Stay
Stay 
Trading Conditions
Products
Tools


On Friday, the euro/dollar pair moved in a sideways channel, testing the support level of 1.1266 (blue thick line). After that, the price went up, almost reaching the upper fractal of 1.1347 (daily candlestick from December 2). On Friday, the pair closed the daily candlestick at 1.1311. Today, the price may continue to move down. The economic calendar is uneventful on Monday.
Trend analysis (pic. 1).
On Monday, the price may start moving down from the level of 1.1311 (the closing of Friday's daily candlestick) to the target level of 1.1277 - the support level (blue bold line). When testing this level, the price may rise to the target level of 1.1379 – a retracement level of 38.2% (blue dotted line).
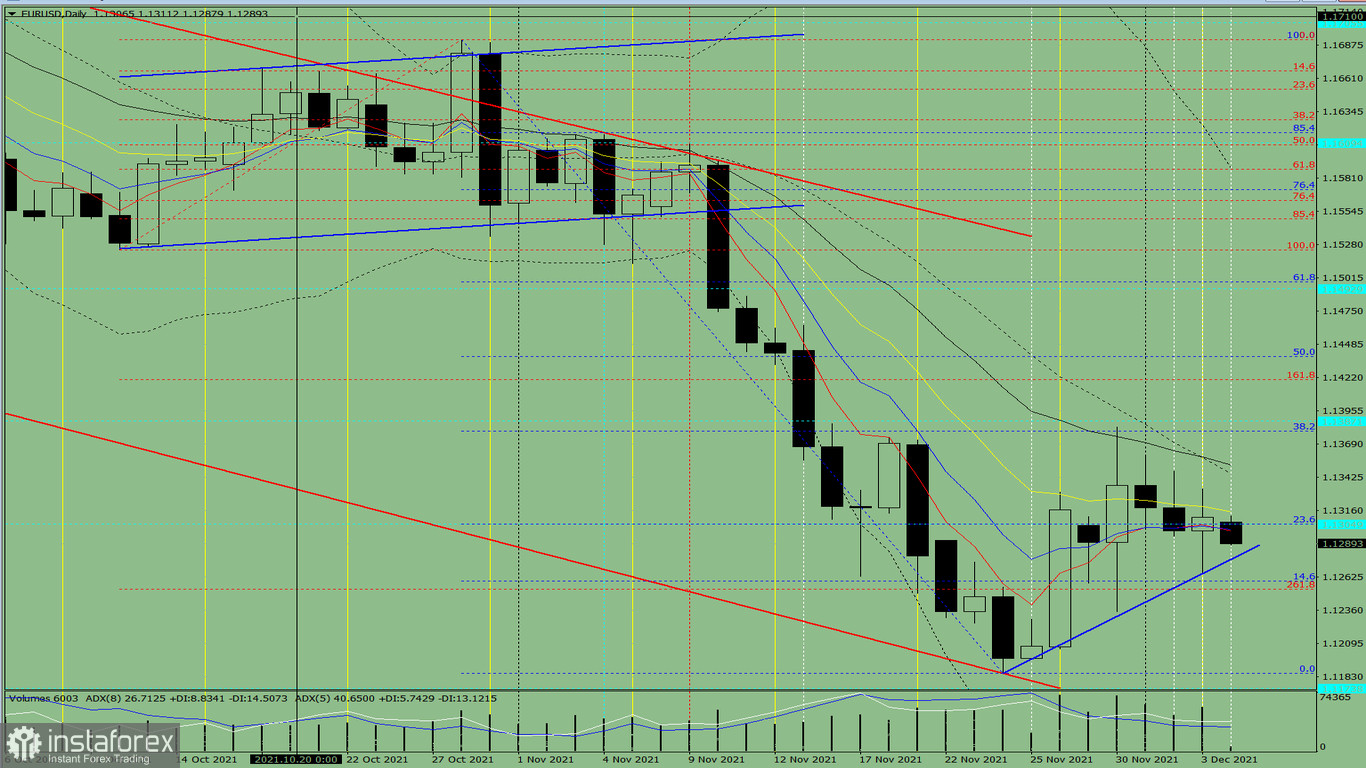
Pic. 1 (daily chart).
Complex analysis:
- technical indicator analysis – down;
- Fibonacci retracement levels - down;
- trading volumes - down;
- candlestick analysis - down;
- trend analysis - up;
- Bollinger bands - down;
- weekly chart - down.
Conclusion:
Today, the price may start moving down from the level of 1.1311 (the closing of Friday's daily candlestick) to the target level of 1.1277 - the support level (blue bold line). When testing this level, the price may rise to the target level of 1.1379 – a retracement level of 38.2% (blue dotted line).
Alternatively, the price may drop to the target level of 1.1277, the support line (blue bold line), from the level of 1.1311 (the closing of Friday's daily candlestick). When testing this level, the price may reach 1.1253, the target level of 261.8% (red dotted line).
When testing this level, the quotes may rebound to 1.1305 – a retracement level of 23.6% (blue dotted line).
InstaForex analytical reviews will make you fully aware of market trends! Being an InstaForex client, you are provided with a large number of free services for efficient trading.

