 Stay
Stay 
Trading Conditions
Products
Tools


Yesterday, data on open vacancies in the United States were published, where there was an increase to 11,033 thousand instead of their reduction from 10,438 thousand to 10,369 thousand. This was very unexpected news, but dollar positions were already under pressure from speculators.
It is possible that the market was charged by the speeches of the ECB chairmen, during which the opinion slipped that the regulator could change the sequence of its steps.
"The ECB has long argued that an increase in interest rates will occur only shortly after the end of quantitative easing, but some scientists and officials are now considering the idea of changing the sequence of these two steps, partly in order to reduce the cost of long-term loans even with an increase in short-term rates."
Analysis of trading charts from December 8:
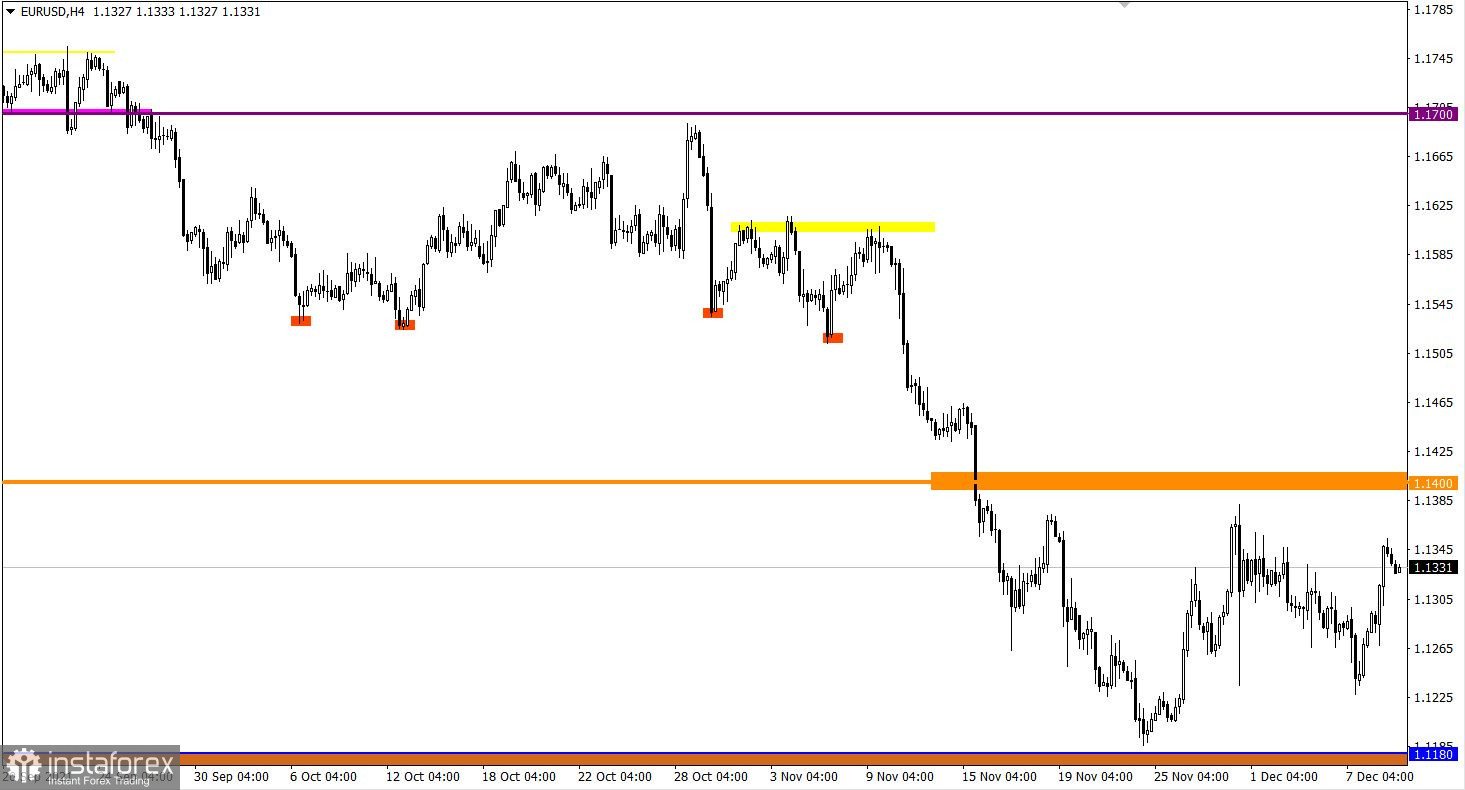
The European currency has partially recovered its lost positions against the US dollar. The euro strengthened by 110 points in the last 24 hours, returning the quote to the area of the local maximum on November 30. This is a fairly strong price change, which may signal an oversaturation of long positions in the market.
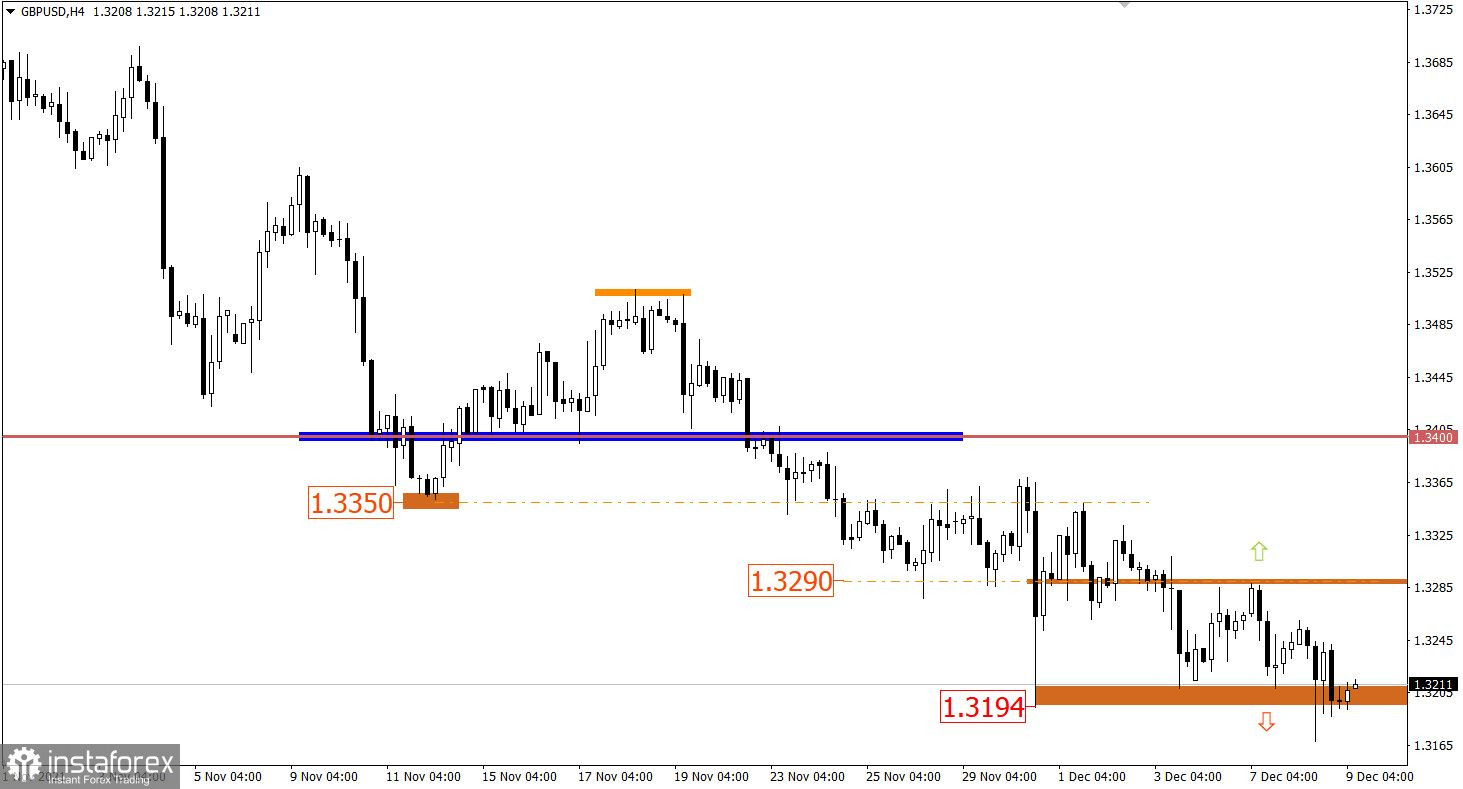
Unlike its European counterpart, the GBP/USD pair shows a downward interest. As a result, the quote updated the local low of 2021, but market participants failed to stay below the level of 1.3190 in a four-hour period.

Today, the United States will release its data on applications for unemployment benefits, where they predict a reduction in their volume.
Details of statistics:
The volume of initial applications for benefits may fall from 222 thousand to 215 thousand.
The volume of repeated applications for benefits may fall from 1,956 thousand to 1,900 thousand.
If the forecast coincides, the US dollar may rise.
Trading plan for EUR/USD on December 9:
Holding the price above the level of 1.1355 may prolong the corrective move towards the resistance level of 1.1400. This will increase the risk of the market moving into the stage of a full-size correction towards the level of 1.1600.
An alternative scenario for the development of the market considers the change of the corrective course to the flat within the borders of 1.1200/1.1350.
It can be assumed that until the quote remains below the level of 1.3190 in the four-hour period, the market remains at risk of resuming the 1.3200/1.3290 side channel. This will slow down the downward cycle with a possible transition to the correction stage.
In the case of considering a downward scenario, sellers have a target, namely the psychological level of 1.3000.
A candlestick chart view is graphical rectangles of white and black light, with sticks on top and bottom. When analyzing each candle in detail, you will see its characteristics of a relative period: the opening price, closing price, and maximum and minimum prices.
Horizontal levels are price coordinates, relative to which a stop or a price reversal may occur. These levels are called support and resistance in the market.
Circles and rectangles are highlighted examples where the price of the story unfolded. This color selection indicates horizontal lines that may put pressure on the quote in the future.
The up/down arrows are the reference points of the possible price direction in the future.
InstaForex analytical reviews will make you fully aware of market trends! Being an InstaForex client, you are provided with a large number of free services for efficient trading.


