 Stay
Stay 
Trading Conditions
Products
Tools


EUR/USD 5M
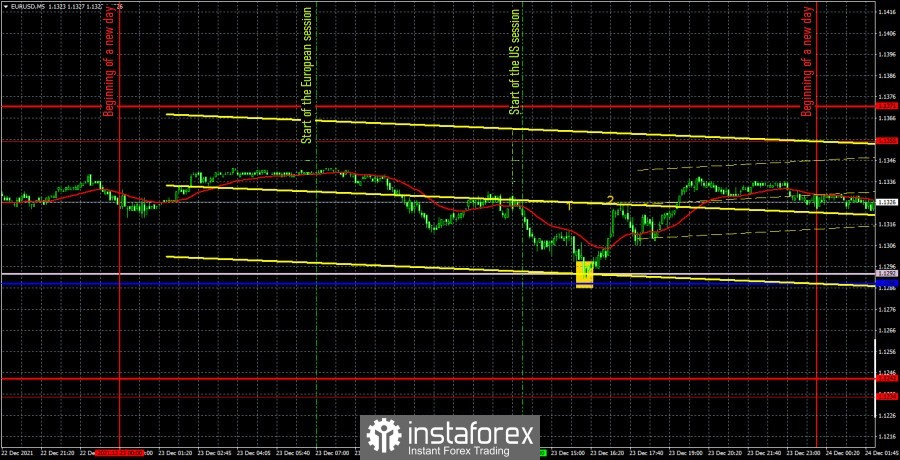
Yesterday, the EUR/USD pair continued to remain between the levels of 1.1234 and 1.1355. It has been in this horizontal channel for about a month. A horizontal channel is not visible on the 5-minute timeframe and it may seem that the pair is moving within the trend. But actually it is not. Flat, though not in the narrowest horizontal channel. Several reports were published in the United States yesterday, but we said in the last article that they are unlikely to cause any reaction from traders. And so it happened. The data on orders for durable goods - the most important report of the day - turned out to be better than forecasted, but if they provoked a movement, then by a high of 15 points (the number "1" in the chart). The same goes for the University of Michigan Consumer Confidence Index (number 2 in the chart). Today, however, has the status of a semi-holiday, because Christmas will be celebrated on the 25th. All that remains for us is to analyze yesterday's trading signals. Actually, there is nothing complicated about this, since only one signal was generated. The price bounced off the Senkou Span B line (1.1292) at the beginning of the US trading session, which should have been regarded as a buy signal and worked out with long positions. Subsequently, the pair went up about 20 points, but failed to reach the nearest target level. Therefore, the deal should have been closed manually at a profit of 20 points in the late afternoon. The total volatility of the day was about 55 points. Average value for the EUR/USD pair.
EUR/USD 1H
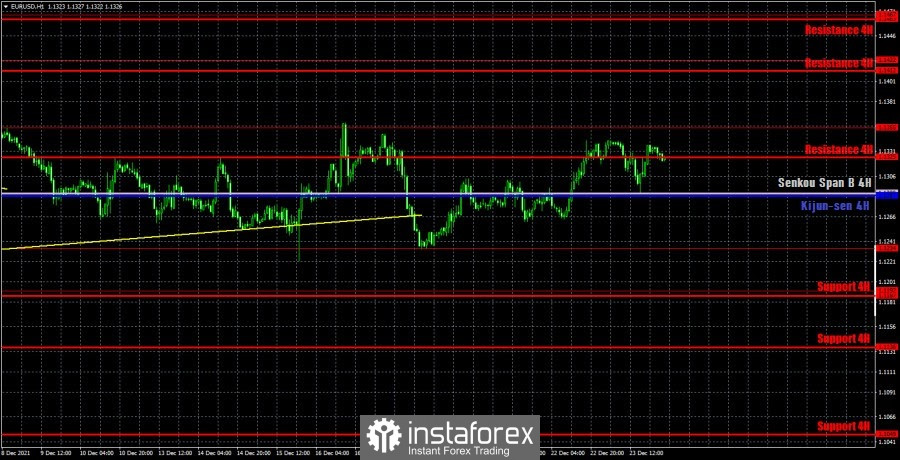
You can clearly see that the pair continues to trade exclusively between the levels of 1.1234 and 1.1355 on the hourly timeframe. Thus, the technical picture has not changed for a very long time. Another reversal inside the horizontal channel took place near the upper limit, but there was no rebound from it. Thus, we are now expecting a downward movement to the level of 1.1234, but first the pair must overcome the Ichimoku indicator lines. We highlight the following levels for trading on Friday - 1.1192, 1.1234, 1.1355, 1.1422, as well as the Senkou Span B (1.1289) and Kijun-sen (1.1287) lines. The Ichimoku indicator lines can change their position during the day, which should be taken into account when looking for trading signals. Signals can be "rebounds" and "breakthroughs" of these levels and lines. Do not forget about placing a Stop Loss order at breakeven if the price moves 15 points in the right direction. This will protect you against possible losses if the signal turns out to be false. You should also take into account the fact that the pair remains flat, so the lines of the Ichimoku indicator are weak. The European Union and the United States will not have a single event and report on December 24. The markets will either be closed or there will be extremely little activity. Therefore, today we do not expect strong movements and high volatility.
We recommend you to familiarize yourself:
Overview of the EUR/USD pair. December 24. What are the prospects for the pair in the coming months?
Overview of the GBP/USD pair. December 24. The pound is ready to rise another 200-300 points.
Forecast and trading signals for GBP/USD for December 24. Detailed analysis of the movement of the pair and trade deals.
Analysis of the COT report
The mood of non-commercial traders has become... a little more bearish during the last reporting week (December 7-13). The "non-commercial" group of traders now has more short positions than long ones, but this advantage is minimal. The difference is only 18,000 contracts, which is not so much. During the reporting week, professional traders closed 7,200 buy contracts (longs) and 2,800 sell contracts (shorts). Thus, the net position of professional players decreased by 4,000. However, the main thing to note is that the green and red lines of the first indicator (indicating the change in the net positions of the non-commercial and commercial groups) have been near the zero level for a long time, as well as in close proximity to each other. That is, in the last few months, when the European currency continued to fall against the dollar, the major players no longer increased their shorts. Thus, the question arises, why did the euro fall at all if market participants did not sell it? Perhaps global factors, such as changes in the balance between the EU and US money supply, are interfering in the exchange rate formation process again. But according to the Commitment of Traders (COT) reports, we can only conclude that the bearish mood is minimal and has not intensified in recent months. Nevertheless, taking into account the fundamental background, the euro may continue to fall. And the technical picture does not yet give any reason to assume the completion of the fall of the euro currency. The mood of the major players remains bearish, but at the same time the bulls do not seek to change anything.
Explanations for the chart:
Support and Resistance Levels are the levels that serve as targets when buying or selling the pair. You can place Take Profit near these levels.
Kijun-sen and Senkou Span B lines are lines of the Ichimoku indicator transferred to the hourly timeframe from the 4-hour one.
Support and resistance areas are areas from which the price has repeatedly rebounded off.
Yellow lines are trend lines, trend channels and any other technical patterns.
Indicator 1 on the COT charts is the size of the net position of each category of traders.
Indicator 2 on the COT charts is the size of the net position for the non-commercial group.
InstaForex analytical reviews will make you fully aware of market trends! Being an InstaForex client, you are provided with a large number of free services for efficient trading.

