 Stay
Stay 
Trading Conditions
Products
Tools


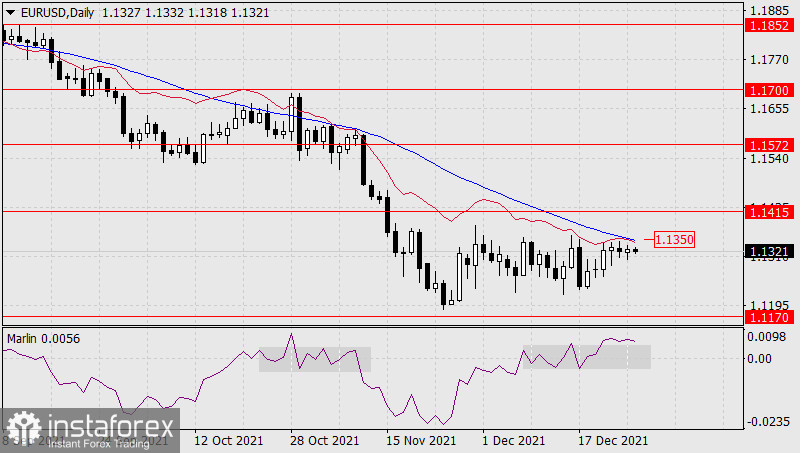
For the fourth day, the euro is moving in a narrow sideways direction under the MACD indicator line on the daily scale chart. And the longer this sideways trend lasts, the more likely the price will break above this indicator line (1.1350). The signal line of the Marlin Oscillator moves strictly horizontally above the consolidation range marked with a gray rectangle, which ultimately creates a forecast for the following technical picture: the price will break above the MACD line (1.1350), but for a very short time, return below it, the Marlin Oscillator will return to its own consolidation and the price will continue to decline towards the target of 1.1170. In this case, the target level 1.1415 may not be reached. But if the euro is able to overcome the situation, breaks above 1.1415, then further growth will continue to the target level of 1.1572.
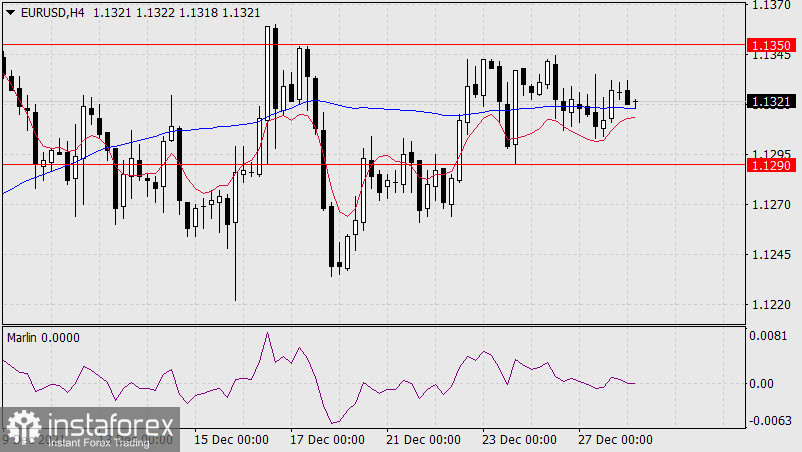
On the four-hour scale chart, the price settled above the MACD line, the Marlin Oscillator, after a false move into the negative zone, returned to the positive area. These are signs that the price is preparing to jump up to the 1.1350 resistance with the intention of breaking it.
InstaForex analytical reviews will make you fully aware of market trends! Being an InstaForex client, you are provided with a large number of free services for efficient trading.


