 Stay
Stay 
Trading Conditions
Products
Tools


EUR/USD 5M
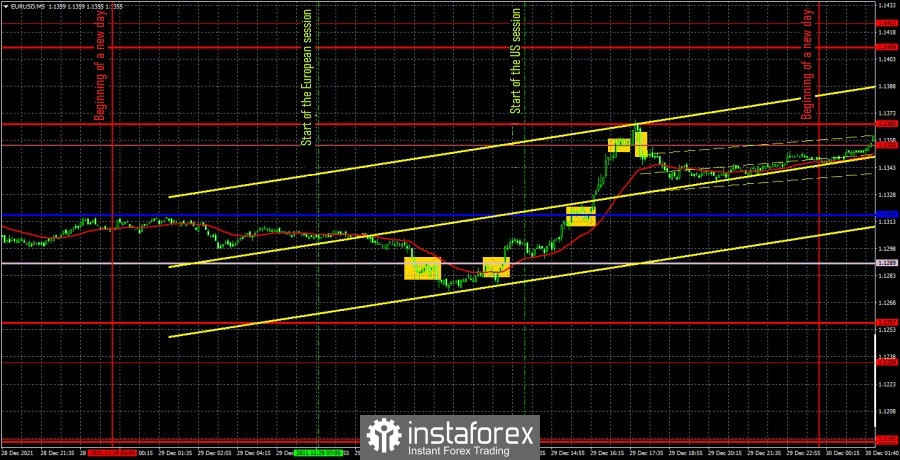
The EUR/USD pair very unexpectedly showed high volatility on Wednesday, passing almost 100 points during the day. Needless to say, the pair demonstrates such volatility after the meetings of the Federal Reserve or the European Central Bank, and even then not always. Thus, it was rather strange to see such a movement on Wednesday, when the pair has been inside the horizontal channel for more than a month. Nevertheless, there was movement, but even that did not help the pair to leave the horizontal channel! By the end of the trading day, quotes were again near the level of 1.1355, which is the upper border of the channel, and bounced off this level again. Thus, the pair remains flat, although it is not obvious at all on the 5-minute timeframe. No important macroeconomic statistics in either the European Union or the United States on Wednesday. There were only two absolutely secondary reports in America, which theoretically could provoke a movement in a thin market. But even in the current environment, 100 points is too strong a reaction for reports like the balance of commodities trade. Since the movement was not bad during the day, trading signals were formed. The first was formed when the pair dropped below the Senkou Span B line and turned out to be false. According to it, traders could lose around 20 points. However, the following signals were already more accurate. A buy signal near the same Senkou Span B line allowed traders to open long positions, which should have been closed already near the level of 1.1366. This level is a resistance level that can be used to close positions, but no signals are formed around it. Since it bounced off, and then closed below 1.1355, the long position should have been closed. The profit was 50 points. It was formally possible to work out the last sell signal, but the time was already late for opening deals. Thus, on the last short position, you could earn up to 10 points by quickly closing it manually.
EUR/USD 1H
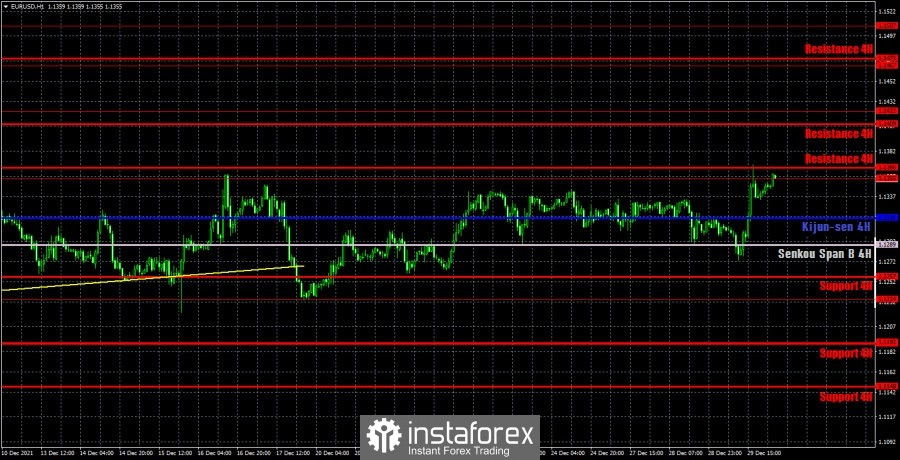
On the hourly timeframe, you can clearly see how the pair turned up very sharply and reached the level of 1.1355, from which it rebounded. Therefore, now a new round of the downward movement inside the horizontal channel of 1.1234-1.1355 may begin again. Moving to the lower border of this channel. We highlight the following levels for trading on Thursday - 1.1192, 1.1234, 1.1355, 1.1422, as well as the Senkou Span B (1.1289) and Kijun-sen (1.1316) lines. The Ichimoku indicator lines can change their position during the day, which should be taken into account when looking for trading signals. Signals can be "rebounds" and "breakthroughs" of these levels and lines. Do not forget about placing a Stop Loss order at breakeven if the price moves 15 points in the right direction. This will protect you against possible losses if the signal turns out to be false. You should also take into account the fact that the pair remains flat, so the lines of the Ichimoku indicator are weak. No important events in the European Union and the United States on December 30. Formally, you can pay attention to the report on applications for unemployment benefits, but again, the likelihood of its working out by traders is low.
We recommend you to familiarize yourself:
Overview of the EUR/USD pair. December 30. The epidemic situation in the world is deteriorating, traders are resting and celebrating.
Overview of the GBP/USD pair. December 30. The pound continues to ignore the monstrous disease statistics in the UK.
Forecast and trading signals for GBP/USD for December 30. Detailed analysis of the movement of the pair and trade deals.
Analysis of the COT report
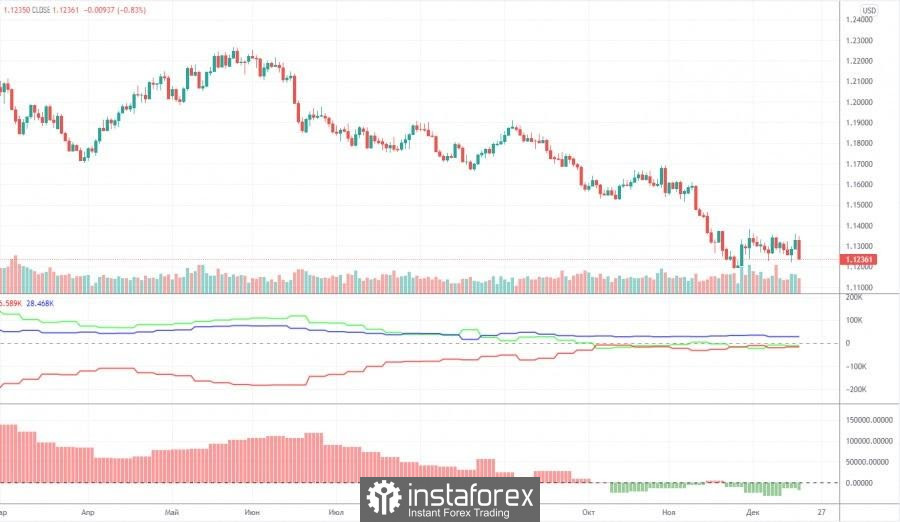
The mood of non-commercial traders has become... a little more bearish during the last reporting week (December 7-13). The "non-commercial" group of traders now has more short positions than long ones, but this advantage is minimal. The difference is only 18,000 contracts, which is not so much. During the reporting week, professional traders closed 7,200 buy contracts (longs) and 2,800 sell contracts (shorts). Thus, the net position of professional players decreased by 4,000. However, the main thing to note is that the green and red lines of the first indicator (indicating the change in the net positions of the non-commercial and commercial groups) have been near the zero level for a long time, as well as in close proximity to each other. That is, in the last few months, when the European currency continued to fall against the dollar, the major players no longer increased their shorts. Thus, the question arises, why did the euro fall at all if market participants did not sell it? Perhaps global factors, such as changes in the balance between the EU and US money supply, are interfering in the exchange rate formation process again. But according to the Commitment of Traders (COT) reports, we can only conclude that the bearish mood is minimal and has not intensified in recent months. Nevertheless, taking into account the fundamental background, the euro may continue to fall. And the technical picture does not yet give any reason to assume the completion of the fall of the euro currency. The mood of the major players remains bearish, but at the same time the bulls do not seek to change anything.
Explanations for the chart:
Support and Resistance Levels are the levels that serve as targets when buying or selling the pair. You can place Take Profit near these levels.
Kijun-sen and Senkou Span B lines are lines of the Ichimoku indicator transferred to the hourly timeframe from the 4-hour one.
Support and resistance areas are areas from which the price has repeatedly rebounded off.
Yellow lines are trend lines, trend channels and any other technical patterns.
Indicator 1 on the COT charts is the size of the net position of each category of traders.
Indicator 2 on the COT charts is the size of the net position for the non-commercial group.
InstaForex analytical reviews will make you fully aware of market trends! Being an InstaForex client, you are provided with a large number of free services for efficient trading.

