 Stay
Stay 
Trading Conditions
Products
Tools


EUR/USD 5M
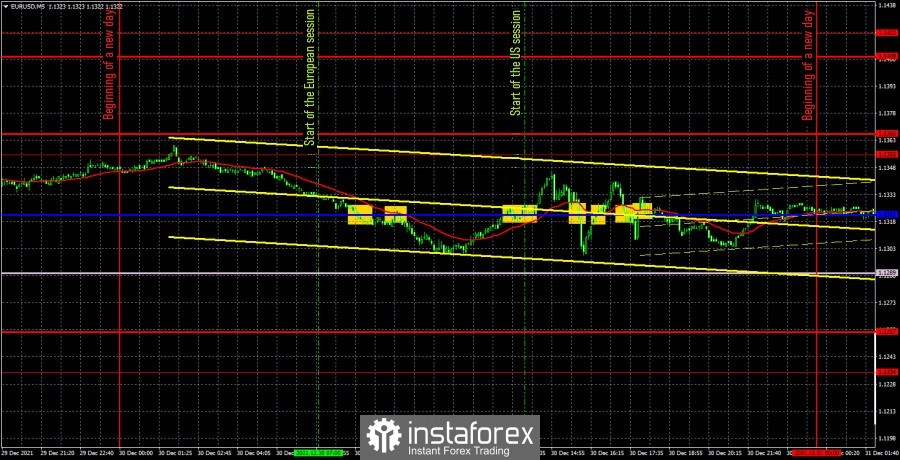
The EUR/USD pair was trading probably as it should on December 30. However, in general, the nature of the pair's movement has not changed for more than a month. This is not noticeable and is not felt on the 5-minute TF, but on higher timeframes it is clearly visible that the pair has been in the horizontal channel for five weeks! Thus, in any case, the market is now flat. However, it also developed within a single day – December 30! All day long, the price has been spinning around the critical line, forming signals around it in batches. Naturally, yesterday there were no reports from the US or in the European Union, so the markets had nothing to react to again. A single report on unemployment claims did not provoke any reaction. It turns out that traders should have traded exclusively on "technique" again. It remains only to figure out exactly how this should be done. The first two signals near the critical line should be worked out. At first, the price settled below it, and then bounced off it from below. Thus, one short position should have been opened here. With grief in half, the price was able to crawl down 15 points, which was enough for a Stop Loss order at breakeven. The short position was closed on this order. This was followed by a buy signal when the price settled above the critical line. And again, the pair managed to go up 15 points, which made it possible to set a Stop Loss at breakeven, at which the deal closed. Well, all subsequent signals near the Kijun-sen line should have already been ignored, since as many as two of them turned out to be false. As it became clear later, all other signals also turned out to be false. As a result, zero profit was obtained. The total volatility of the day was 61 points.
EUR/USD 1H
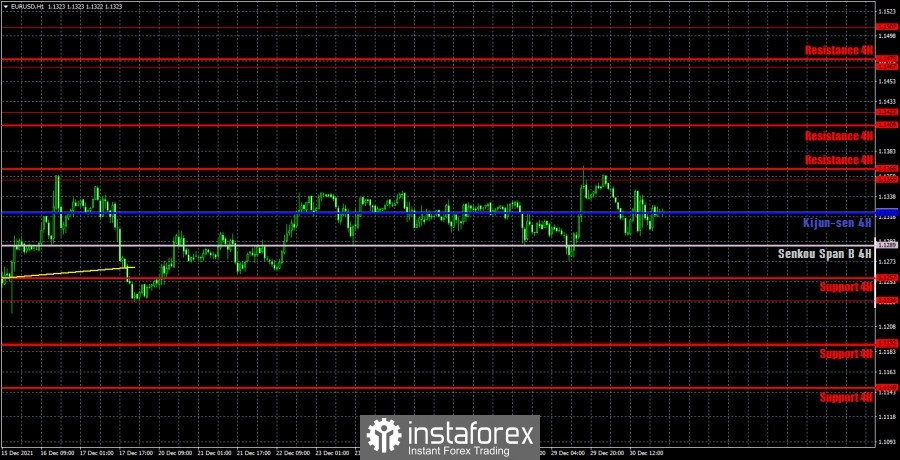
The hourly timeframe shows how the pair continues to trade inside the 1.1234–1.1355 horizontal channel. A day earlier, the price bounced twice from the level of 1.1355, so now we can expect movement to the lower border of the channel near the level of 1.1234. However, it can take from several days to a week. Thus, we are waiting for this movement in the new year. We allocate the following levels for trading on Friday - 1.1192, 1.1234, 1.1355, 1.1422, as well as the Senkou Span B(1.1289) and Kijun-sen(1.1322) lines. The lines of the Ichimoku indicator may change their position during the day, which should be taken into account when searching for trading signals. Signals can be "rebounds" and "breakthroughs" of these levels and lines. Do not forget about placing a Stop Loss order at breakeven if the price moves 15 points in the right direction. This will protect you against possible losses if the signal turns out to be false. It should also be taken into account the fact that the pair remains flat, so the lines of the Ichimoku indicator are weak. Neither the European Union nor the United States has scheduled any important events on December 31, nor any important macroeconomic reports.
We recommend you to familiarize yourself:
Overview of the EUR/USD pair. December 31. Traders started preparing for the New Year back in November.
Overview of the GBP/USD pair. December 31. The pound is waiting for another fun year.
Forecast and trading signals for GBP/USD for December 31. Detailed analysis of the movement of the pair and trade deals.
Analysis of the COT report
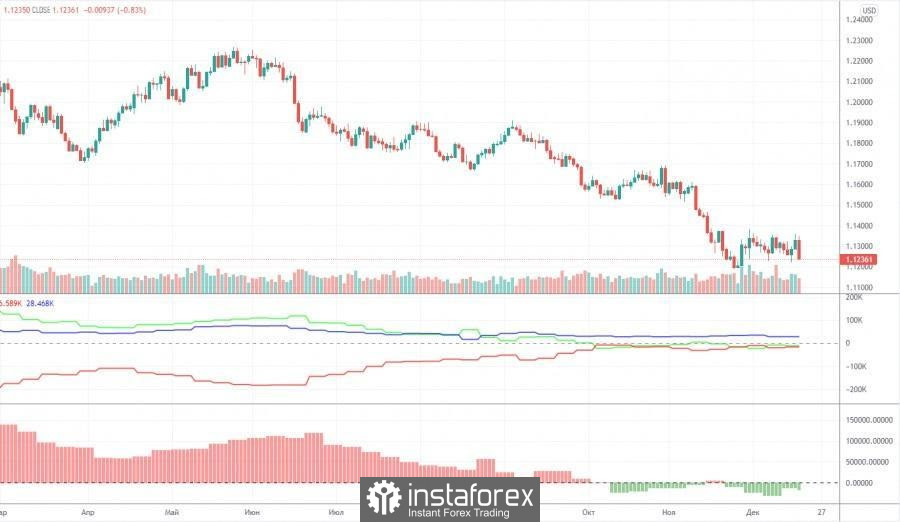
The mood of non-commercial traders has become... a little more bearish during the last reporting week (December 7-13). The "non-commercial" group of traders now has more short positions than long ones, but this advantage is minimal. The difference is only 18,000 contracts, which is not so much. During the reporting week, professional traders closed 7,200 buy contracts (longs) and 2,800 sell contracts (shorts). Thus, the net position of professional players decreased by 4,000. However, the main thing to note is that the green and red lines of the first indicator (indicating the change in the net positions of the non-commercial and commercial groups) have been near the zero level for a long time, as well as in close proximity to each other. That is, in the last few months, when the European currency continued to fall against the dollar, the major players no longer increased their shorts. Thus, the question arises, why did the euro fall at all if market participants did not sell it? Perhaps global factors, such as changes in the balance between the EU and US money supply, are interfering in the exchange rate formation process again. But according to the Commitment of Traders (COT) reports, we can only conclude that the bearish mood is minimal and has not intensified in recent months. Nevertheless, taking into account the fundamental background, the euro may continue to fall. And the technical picture does not yet give any reason to assume the completion of the fall of the euro currency. The mood of the major players remains bearish, but at the same time the bulls do not seek to change anything.
Explanations for the chart:
Support and Resistance Levels are the levels that serve as targets when buying or selling the pair. You can place Take Profit near these levels.
Kijun-sen and Senkou Span B lines are lines of the Ichimoku indicator transferred to the hourly timeframe from the 4-hour one.
Support and resistance areas are areas from which the price has repeatedly rebounded off.
Yellow lines are trend lines, trend channels and any other technical patterns.
Indicator 1 on the COT charts is the size of the net position of each category of traders.
Indicator 2 on the COT charts is the size of the net position for the non-commercial group.
InstaForex analytical reviews will make you fully aware of market trends! Being an InstaForex client, you are provided with a large number of free services for efficient trading.


