 Stay
Stay 
Trading Conditions
Products
Tools


Trend analysis (Fig. 1).
Today, the price from the level of 1.1324 (closing of yesterday's daily candle) is expected to further decline in order to reach the lower fractal – 1.1298 (daily candle from 12/30/2021). After testing this level, the upward movement may continue to the target of 1.1369 – the upper border of the Bollinger line indicator (black dotted line).
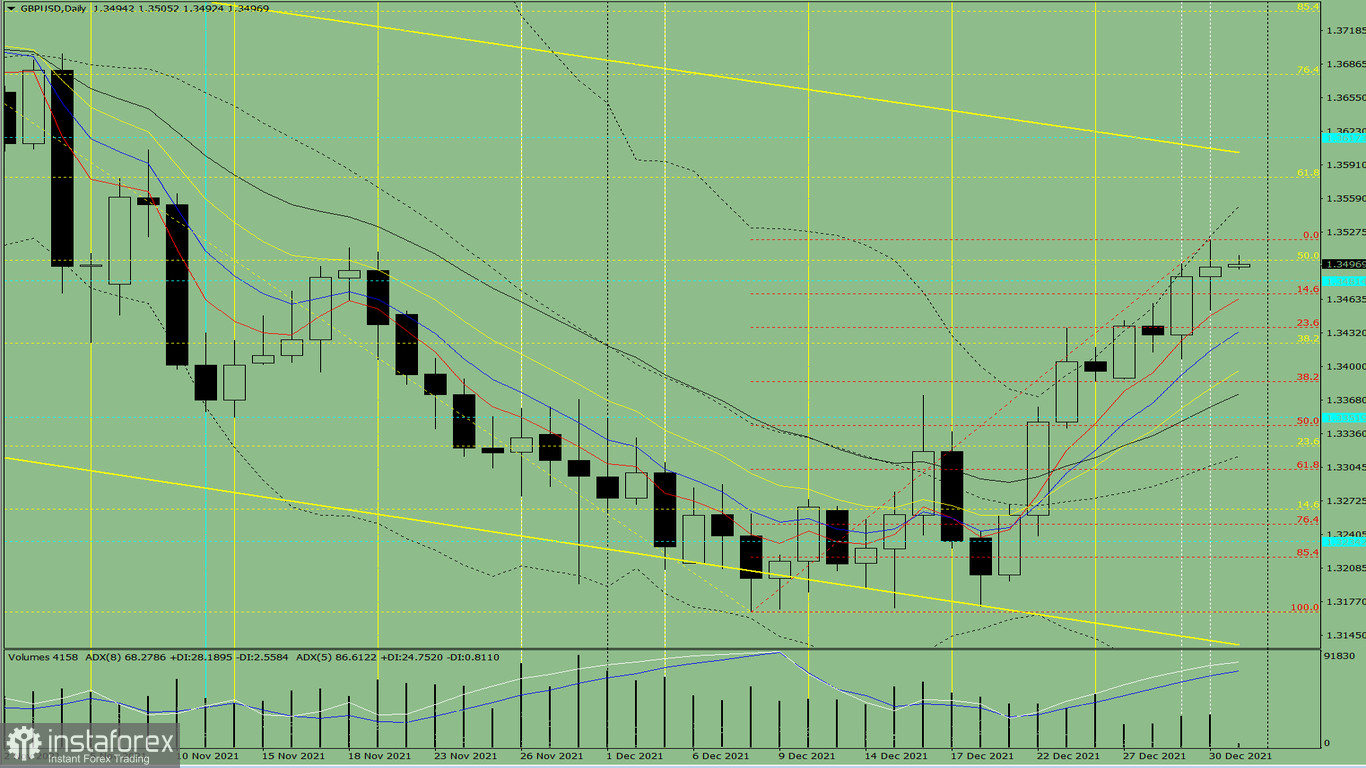
Fig 1 (daily chart)
Comprehensive analysis:
General conclusion:
The price from the level of 1.1324 (closing of yesterday's daily candle) may continue to fall today in order to reach the lower fractal – 1.1298 (daily candle from 12/30/2021). Once this level is tested, it may grow again to the target of 1.1369 – the upper border of the Bollinger line indicator (black dotted line).
As an alternative, it is possible for the price from the level of 1.1324 (closing of yesterday's daily candle) to continue to decline to reach the lower fractal of 1.1273 (daily candle from 12/29/2021). After testing it, it is likely to rise to the target of 1.1317 – 21 average EMA (black thin line).
InstaForex analytical reviews will make you fully aware of market trends! Being an InstaForex client, you are provided with a large number of free services for efficient trading.

