 Stay
Stay 
Trading Conditions
Products
Tools


EUR/USD 5M
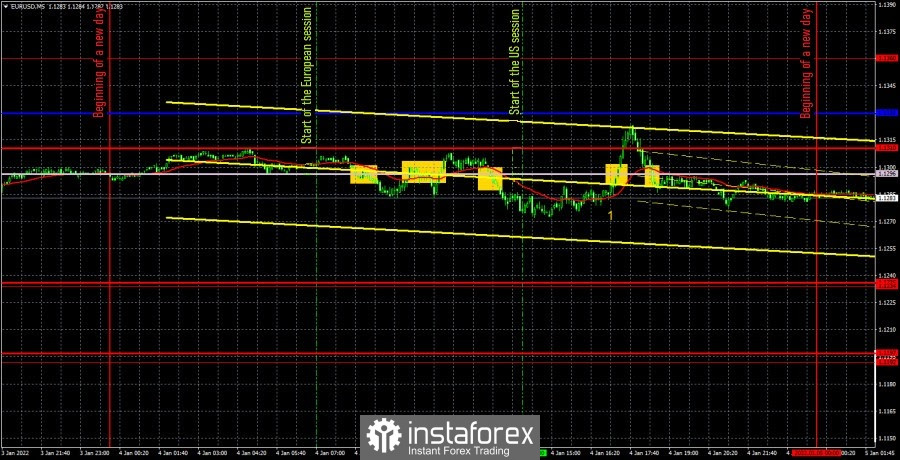
The EUR/USD pair was trading in almost absolute flat on Tuesday. Volatility was around 50 points, and there was no trend movement during the day. There were practically no macroeconomic statistics during the day. We can only note the index of business activity in the US manufacturing ISM, which turned out to be slightly weaker than forecasted. The time of its publication is marked with the number "1" in the chart. As you can see, after that the dollar fell by 40 points, so we can say that the markets reacted to the report, but in the next couple of hours the pair's quotes returned to their original positions. After the price dropped 100 points on Monday and returned to the horizontal channel, in which it spent the last month, the likelihood of preserving a flat increased again. At this time, there is no clear trend, which can be seen absolutely on all timeframes, including the 4-hour one. Thus, all that remains is to deal with the trading signals. All of them were formed near the Senkou Span B. This is vivid proof that the pair was flat on Tuesday. In other words, the price circled around the same line all day. Naturally, most of the signals turned out to be false. However, only the first two should have been worked out. First, a short position had to be opened, and then a long position. In both cases, the price could not go in the right direction even 15 points, which would be enough to place a Stop Loss order at breakeven. Therefore, unfortunately, a loss of 30 points was received on both trades. All subsequent trading signals should not have been worked out, since at that time already two deals were unprofitable according to the signal from the Senkou Span B.
We recommend you to familiarize yourself:
Overview of the EUR/USD pair. January 5. 2022 begins with the release of NonFarm Payrolls.
Overview of the GBP/USD pair. January 5. The pound starts the year at its highs, and Boris Johnson rejected the idea of introducing a lockdown.
Forecast and trading signals for GBP/USD for January 5. Detailed analysis of the movement of the pair and trade deals.
EUR/USD 1H
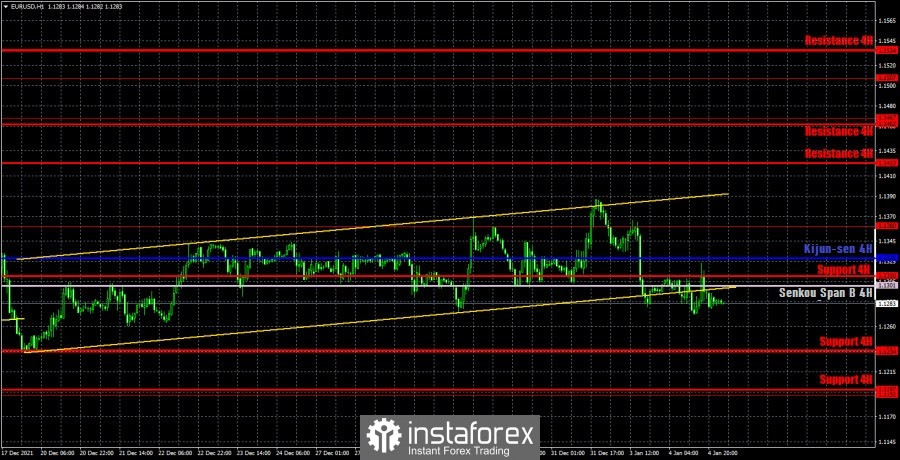
On the hourly timeframe, the pair's quotes dropped below the rising channel yesterday, which we called a very formal one. The fact is that its angle of inclination is minimal, and the horizontal movement of the pair is clearly visible on almost any timeframe. And this flat has been going on for more than a month. Therefore, even if the euro has added 50-100 points during this period, the movement is still more horizontal than upward. Thus, we would conclude that the price has now returned to the 1.1234-1.1360 channel. Consequently, horizontal movement may persist and false signals may form in the coming days. We highlight the following levels for trading on Wednesday - 1.1192, 1.1234, 1.1360, 1.1422, as well as the Senkou Span B (1.1301) and Kijun-sen (1.1328) lines. The Ichimoku indicator lines can change their position during the day, which should be taken into account when looking for trading signals. Signals can be "rebounds" and "breakthroughs" of these levels and lines. Do not forget about placing a Stop Loss order at breakeven if the price moves 15 points in the right direction. This will protect you against possible losses if the signal turns out to be false. You should also take into account the fact that flat is again very likely now, therefore the lines of the Ichimoku indicator are weak. The European Union will publish an index of business activity in the services sector, and in the US - a similar index, but also the ADP report on changes in the number of employees in the private sector and the Federal Reserve minutes from the last meeting. We believe that in a thin market, US events may trigger a market reaction.
Explanations for the chart:
Support and Resistance Levels are the levels that serve as targets when buying or selling the pair. You can place Take Profit near these levels.
Kijun-sen and Senkou Span B lines are lines of the Ichimoku indicator transferred to the hourly timeframe from the 4-hour one.
Support and resistance areas are areas from which the price has repeatedly rebounded off.
Yellow lines are trend lines, trend channels and any other technical patterns.
Indicator 1 on the COT charts is the size of the net position of each category of traders.
Indicator 2 on the COT charts is the size of the net position for the non-commercial group.
InstaForex analytical reviews will make you fully aware of market trends! Being an InstaForex client, you are provided with a large number of free services for efficient trading.

