 Stay
Stay 
Trading Conditions
Products
Tools


GBP/USD 5M
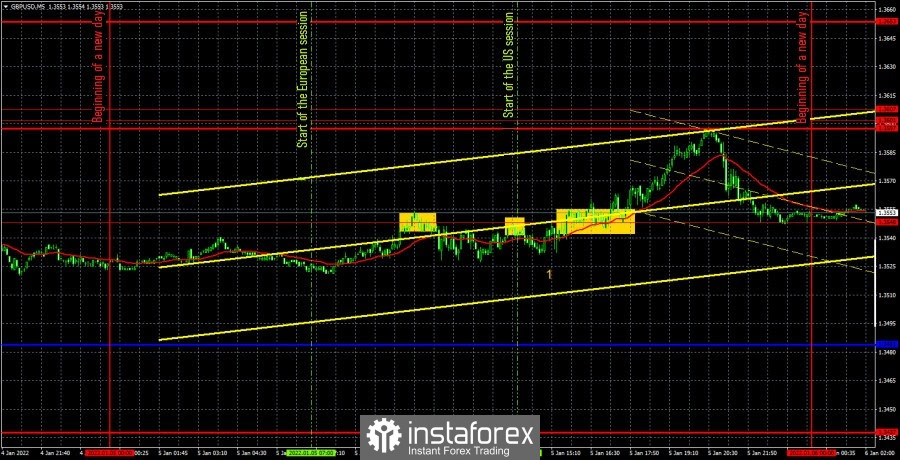
The GBP/USD pair moved as sluggishly and incomprehensibly as possible on Wednesday. A more or less strong movement began only towards the end of the evening. The volatility of the day was about 70-80 points. Unfortunately, the normal movement began only in the evening, and all three signals were formed around the same level, indicating a flat during the day. Of the macroeconomic events, we can note the ADP report on the change in the number of employees in the US private sector, which had no effect on the dollar. Meanwhile, the calendar of macroeconomic events was completely empty in Great Britain. And to say that with such volatility, the pair was influenced by the "foundation", does not work in any case. All that remains is to analyze the trading signals. The first signal – for short positions - was formed when the price bounced from the extreme level of 1.3548 in the European trading session. The pair failed to go down even 20 points after its formation and returned to the level of 1.3548 twice. In the first case, there was a rebound from it, which enabled us to stay in short positions, in the second case, the pair surpassed it, so short positions had to be manually closed . The loss was about 20 points. The long position should not have been opened, since it became clear that the pair was moving with low volatility at the beginning of the US trading session, and there was no trend movement.
We recommend you to familiarize yourself:
Overview of the EUR/USD pair. January 6. The market awaits Nonfarms on Friday. The euro expects a weak December value.
Overview of the GBP/USD pair. January 6. Boris Johnson risks leaving his post before the end of this year.
Forecast and trading signals for EUR/USD for January 6. Detailed analysis of the movement of the pair and trade deals.
GBP/USD 1H
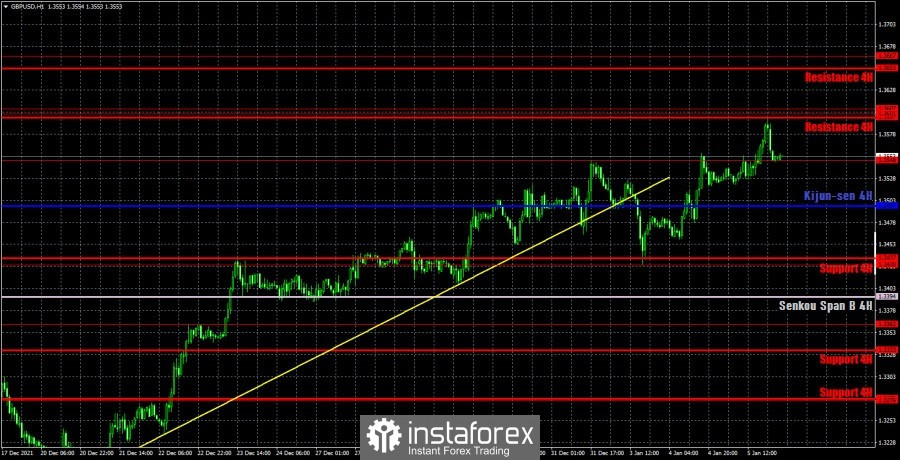
On the hourly timeframe, the pound/dollar pair resumed the upward trend despite the fact that it had previously overcome the upward trend line, and despite the fact that yesterday's movement was as vague as possible. Nevertheless, it surpassed the level of 1.3548, which opens the way for the British currency to new heights. Recall that in recent weeks, the pound has risen quite well, but at the same time it had no fundamental reasons for growth. Consequently, the fall can still start at almost any moment. We need to be ready for this. We have rebuilt the rising trend line so that it supports the upward movement again, but a new consolidation below it will significantly increase the probability of a sharp fall for the pair. We highlight the following important levels on January 6: 1.3430, 1.3548, 1.3601-1.3607, 1.3667. The Senkou Span B (1.3394) and Kijun-sen (1.3497) lines can also be signal sources. Signals can be "rebounds" and "breakthroughs" of these levels and lines. It is recommended to set the Stop Loss level to breakeven when the price passes in the right direction by 20 points. The lines of the Ichimoku indicator can move during the day, which should be taken into account when determining trading signals. The UK is set to publish the index of business activity in the service sector on Thursday, which has very little chance of influencing the pair's movement. In America, we can only note the ISM business activity index in the service sector.
Explanations for the chart:
Support and Resistance Levels are the levels that serve as targets when buying or selling the pair. You can place Take Profit near these levels.
Kijun-sen and Senkou Span B lines are lines of the Ichimoku indicator transferred to the hourly timeframe from the 4-hour one.
Support and resistance areas are areas from which the price has repeatedly rebounded off.
Yellow lines are trend lines, trend channels and any other technical patterns.
Indicator 1 on the COT charts is the size of the net position of each category of traders.
Indicator 2 on the COT charts is the size of the net position for the non-commercial group.
InstaForex analytical reviews will make you fully aware of market trends! Being an InstaForex client, you are provided with a large number of free services for efficient trading.


