 Stay
Stay 
Trading Conditions
Products
Tools


What is needed to open long positions on EUR/USD
In my morning article, I turned your attention to the level of 1.1294 and advised you to take trading decisions with this level in focus. Now let's look at the 5-minute chart and try to figure out what has happened. The fundamental inflation data released earlier today boosted demand for EUR. However, early in the morning the bears were eager to push the price down to 1.1294, but their efforts were in vain. In practice, the price rebounded to this level and tested it upwards, thus making an excellent signal to buy EUR. By the moment of writing this article, EUR/USD had grown over 35 pips. The technical picture for the second half of the day is a bit different now.
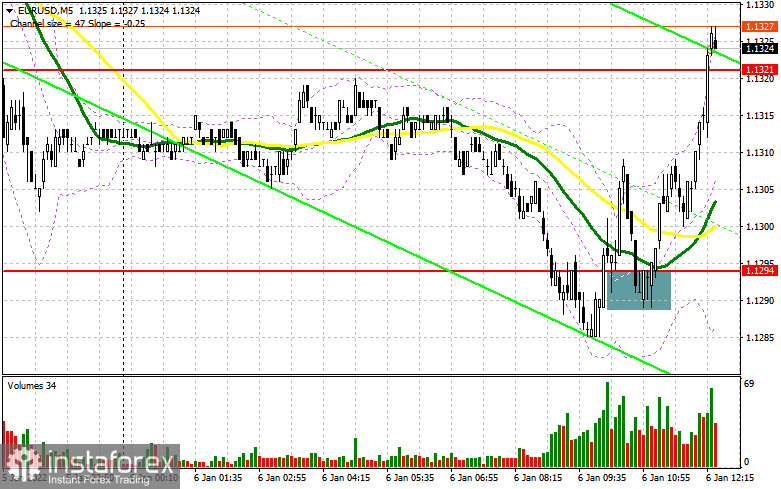
During the American session, traders will get to know a series of data from Germany and the US that might rock market sentiment. Now the bulls are focused on new resistance of 1.1342. However, to break it, the market needs weak statistics on the US economy and upbeat inflation for Germany. US unemployment claims will hardly disturb EUR buyers, but a positive ISM services PMI could stall an intraday bullish trend.
In case EUR/USD declines, only a false breakout at about new support of 1.1313 will be an extra signal to buy EUR, betting on its further rise to resistance at 1.1342. Nevertheless, there is still a challenge to break this area. If tested downwards, this will open the way to new highs of 1.1375 and 1.1415 where I recommend profit taking. 1.1442 is seen as a more distant target. If the pair falls deeply during the American session and the bulls lack activity at about 1.1313 with moving averages passing a bit below this level, it would be better to cancel long positions until the powerful support at 1.1291 that had already benefitted the buyers. Nevertheless, I would recommend opening long positions there on condition of a false breakout. The final hope for the bulls to keep EUR/USD in the uptrend will be a low at 1.1272 from where it is possible to open long positions immediately, bearing in mind an upward 20-25 pips intraday correction.
What is needed to open short positions on EUR/USD
If the pair extends its growth, the sellers have to do their best to defend resistance at 1.1342. In case the US releases strong stats, it will discourage the EUR buyers to fight for this level. A false breakout at 1.1342 will generate the first entry point for short positions as the bears will reckon that the price will drop again to 1.1313. This is the level to fight for. In the bears manage to take it under their control, this will wreck the intraday uptrend. A breakout and a test of this area upwards will generate an extra signal for opening short positions with the prospects of a decline towards support of 1.1291 and 1.1272. If the price goes below these levels, it will activate stop losses of the buyers and entail a large drop with the price making lower lows of 1.1248 and 1.1224 where I recommend profit taking. If EUR grows amid weak US economic data and the bears lack activity at 1.1342, it would be better not to rush opening short positions. The reasonable scenario would be short positions during a fake breakout at near 1.1375. We can sell EUR/USD immediately at highs of 1.1415 and 1.1442, bearig in mind a 15-20 pips intraday correction.

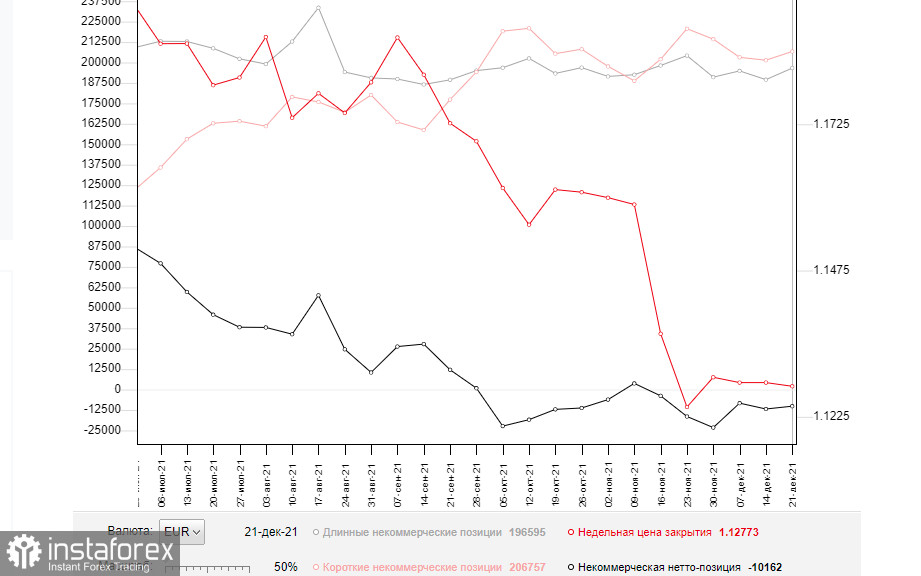
The COT (Commitment of Traders) report from December 28 logs an increase both in short and long positions, albeit long positions grew to a less degree. This contracted the negative value of the delta. Such data reflect the recent policy meetings of the Federal Reserve and the ECB. However, judging by overall market sentiment, nothing has changed. This is confirmed by the chart. A lot of headwinds in the EU and US economies persist due to the Omicron variant that puts central banks on edge. Apparently, the Omicron situation in the new year will determine further monetary policy of the US Fed and the ECB.
The COT report shows that buyers of risky assets, in particular the euro, are in no hurry to increase long positions even in light of the ECB announcements that it is planning to withdraw its emergency bond buying program in March 2022. On the other hand, the US dollar has solid support as the Federal Reserve aims to raise interest rates in the spring 2022 that enhances its investment appeal.
According to the COT report, long non-commercial grew from 189,530 to 196,595 whereas the number of short non-commercial rose from 201,409 to 206,757. It means that the bulls and bears are fighting for their direction. As a result, the overall net non-commercial positions decreased its negative value from -11,879 to -10,162. EUR/USD remained in a trading range for the whole week and closed last week almost at 1.1277, almost at the same level as 1.1283 a week ago.
Indicator's signals:
Trading is carried out slightly above the 30 and 50 daily moving averages. It indicates that the bulls are trying to take over the market.
Moving averages
Note: The period and prices of moving averages are considered by the author on the H1 hourly chart and differs from the general definition of the classic daily moving averages on the daily D1 chart.
Bollinger Bands
In case of an upward move, the indicators' upper border at 1.1342 will serve as resistance. Alternatively, if the pair goes down, the lower border at 1.1290 will act as support.
Description of indicators
InstaForex analytical reviews will make you fully aware of market trends! Being an InstaForex client, you are provided with a large number of free services for efficient trading.


