 Stay
Stay 
Trading Conditions
Products
Tools


EUR/USD 5M
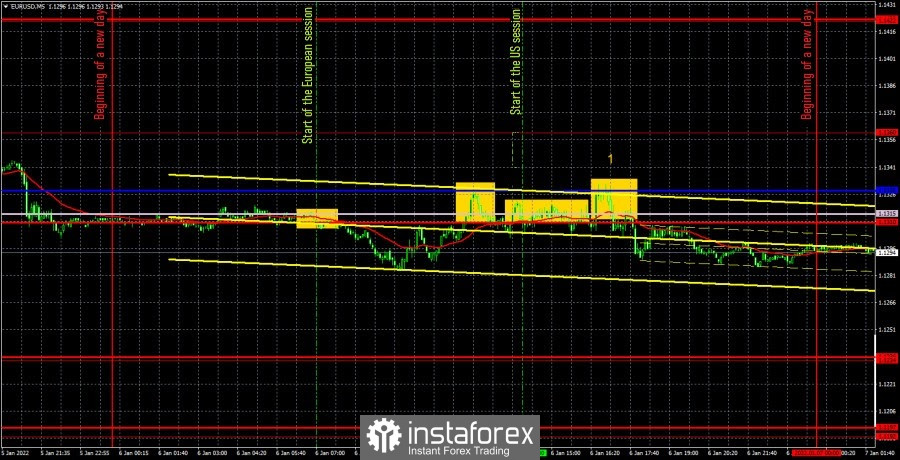
The EUR/USD pair was trading as boring as possible again on Thursday. If a day earlier, it still began to move more or less actively in the evening, which was due to the publication of the Federal Reserve minutes, then there were no such strong drivers on Thursday. Therefore, this time the volatility of the pair did not exceed 50 points. It should be noted right away that the only more or less significant event of the day was the publication of the ISM business activity index in the US services sector. This index is average in strength, but despite the fact that its actual value turned out to be much lower than the forecast and the previous one, the markets, we can say, did not react to it in any way. The value of business activity decreased from 69.1 to 62.0, but the dollar only got more expensive after the report was published. It should also be noted right away that the Senkou Span B and Kijun-sen lines should be considered as an area of resistance, since they were located too close to each other. As a result, flat + double line area = mass of false signals. Basically, the pair has been hanging around this area all day. The first sell signal was formed when the price bounced off the Senkou Span B. Here, traders could open short positions that managed to close at breakeven, as the Stop Loss worked: the pair first went down 20 points, and then returned to Senkou Span B. The next signal was also for short positions, when the price bounced from the area of the Ichimoku lines, but this time the downward movement did not continue, and the price began trading between Kijun-sen and Senkou Span B. As a result, it never managed to settle above the critical line, so the short position could be manually closed at any time. At least, in zero profit, as a high - in profit up to 10 points. With such a movement as yesterday, it was difficult to count on profitable trades.
We recommend you to familiarize yourself:
Overview of the EUR/USD pair. January 7. The Fed will be busy raising rates in the next two to three years.
Overview of the GBP/USD pair. January 7. The negative impact of Brexit on the UK is becoming more and more conspicuous.
Forecast and trading signals for GBP/USD for January 7. Detailed analysis of the movement of the pair and trade deals.
EUR/USD 1H
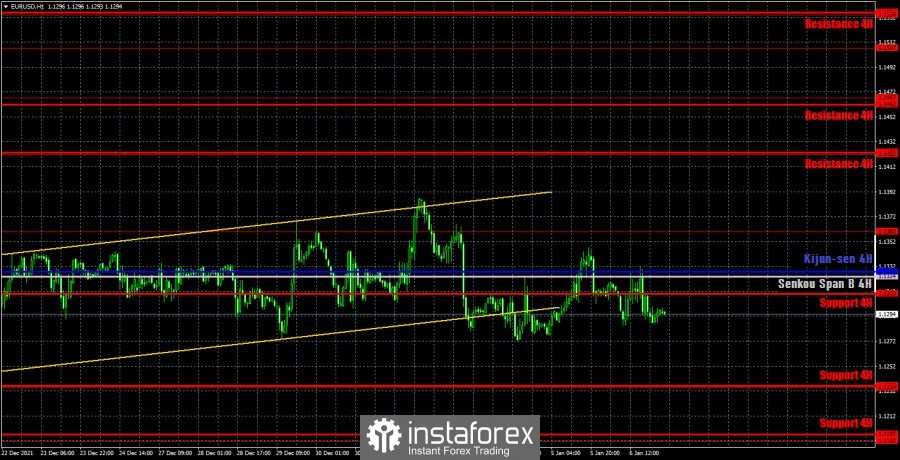
The pair's technical picture on the hourly timeframe does not change completely. The price continues to remain between the levels of 1.1234 and 1.1360 for almost a month and a half, so we can't make any other conclusion except: keeping the flat. And if so, then the lines of the Ichimoku indicator are weak now, the pair's movements are as unpredictable as possible. If only signals for a rebound were formed at least near the borders of the horizontal channel... But they are not formed either. We allocate the following levels for trading on Friday - 1.1192, 1.1234, 1.1360, 1.1422, as well as the Senkou Span B (1.1324) and Kijun-sen (1.1328) lines. The lines of the Ichimoku indicator may change their position during the day, which should be taken into account when searching for trading signals. Signals can be "rebounds" and "breakthroughs" of these levels and lines. Do not forget about placing a Stop Loss order at breakeven if the price moves 15 points in the right direction. This will protect you against possible losses if the signal turns out to be false. You should also take into account the fact that flat is very likely now again, so the lines of the Ichimoku indicator are weak. Today, the European Union will publish an inflation report for December. According to forecasts, inflation may slow down to 4.8%, but such a decrease is not significant and is unlikely to affect the pair's movement. The most important NonFarm Payrolls report for December will be released in America today with a forecast of +410,000, as well as an unemployment report (may decrease to 4.1%) and a report on wages. Thus, Friday can be a very busy day. And volatile.
Explanations for the chart:
Support and Resistance Levels are the levels that serve as targets when buying or selling the pair. You can place Take Profit near these levels.
Kijun-sen and Senkou Span B lines are lines of the Ichimoku indicator transferred to the hourly timeframe from the 4-hour one.
Support and resistance areas are areas from which the price has repeatedly rebounded off.
Yellow lines are trend lines, trend channels and any other technical patterns.
Indicator 1 on the COT charts is the size of the net position of each category of traders.
Indicator 2 on the COT charts is the size of the net position for the non-commercial group.
InstaForex analytical reviews will make you fully aware of market trends! Being an InstaForex client, you are provided with a large number of free services for efficient trading.


