 Stay
Stay 
Trading Conditions
Products
Tools

On Tuesday, EUR / USD will try to rise from 1.1326 (closing of yesterday's daily candle) to the resistance line at 1.1350 (red bold line), then go further up to 1.1379, which is the 38.2% retracement level (blue dotted line).
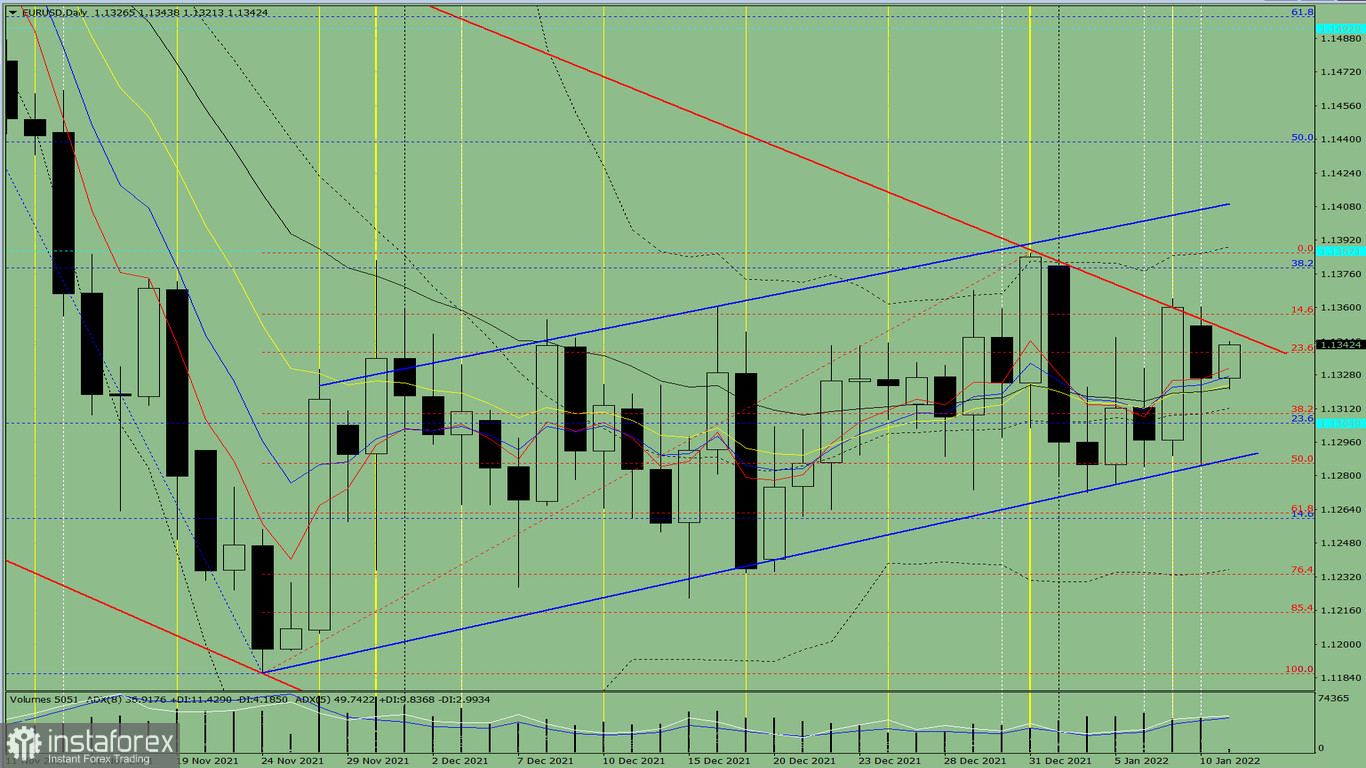
Fig. 1 (daily chart)
Comprehensive analysis:
- Indicator analysis - uptrend;
- Fibonacci levels - uptrend;
- Volumes - uptrend;
- Candlestick analysis - uptrend;
- Trend analysis - uptrend;
- Bollinger bands - uptrend;
- Weekly chart - uptrend.
Conclusion: EUR/USD will climb from 1.1326 (closing of yesterday's daily candle) to the resistance line at 1.1350 (red bold line). Upon reaching that level, it will go further up to 1.1379, which is the 38.2% retracement level (blue dotted line).
Alternatively, the pair could go down to the 38.2% retracement level (red dashed line) at 1.1309 after rising from 1.1326 (closing of yesterday's daily candle) to the resistance line at 1.1350 (red bold line).
InstaForex analytical reviews will make you fully aware of market trends! Being an InstaForex client, you are provided with a large number of free services for efficient trading.


