 Stay
Stay 
Trading Conditions
Products
Tools


GBP/USD 5M
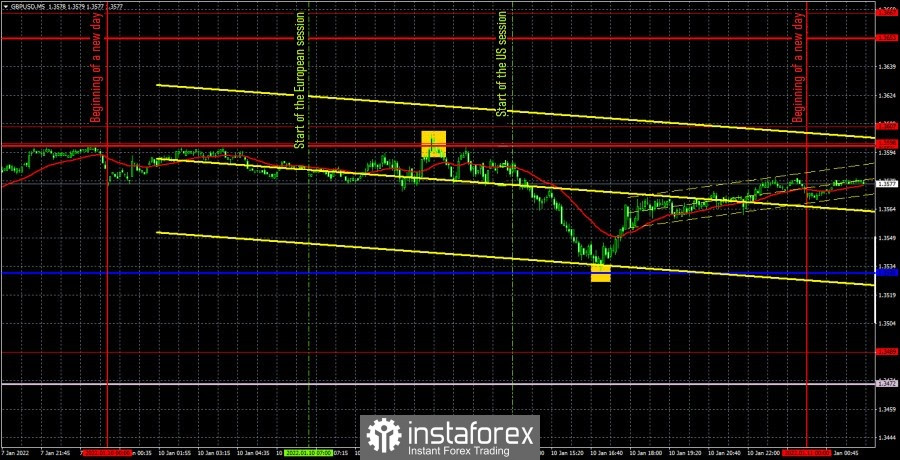
The GBP/USD currency pair resumed its upward movement on Tuesday after much thought. Although a downward movement was observed for most of the day, there were high chances that the expected downward correction would still begin in the medium term. But in the afternoon, the bulls found new reasons to buy, so the pound rose again at the end of the day. The price has risen a bit, and we have already noted in other articles that the movement is weakening. From our point of view, the downward correction should have started a few days ago. The ascending trend line on the hourly TF has already been crossed twice, and there are no new fundamental growth factors. Thus, the pound/dollar pair continues to balance on the verge of correction, but cannot begin it in any way. As for the trading signals on the 5-minute TF, they were not the best on Tuesday. Let's take them apart. The first buy signal was formed when the pair overcame the resistance area of 1.3598-1.3607. However, the upward movement did not continue, the pair immediately began to fall! Thus, the long position had to be closed almost immediately. It was necessary to open new short positions when the pair settled below the indicated area. In this case, the movement was a little more attractive, but the price still failed to work out the nearest target - the Kijun-sen line. However, it still went down 20 points, so a Stop Loss should have been set to breakeven, at which the short position closed when the pair returned to the area of 1.3598-1.3607. The last, third buy signal should no longer be worked out, since at that time two false signals had already formed near this area. As a result, the day ended with a minimal loss of about 20 points.
We recommend you to familiarize yourself:
Overview of the EUR/USD pair. January 12. Jerome Powell promises to fight inflation.
Overview of the GBP/USD pair. January 12. The British economy will face new challenges due to the "safe Omicron".
Forecast and trading signals for EUR/USD for January 12. Detailed analysis of the movement of the pair and trade deals.
GBP/USD 1H
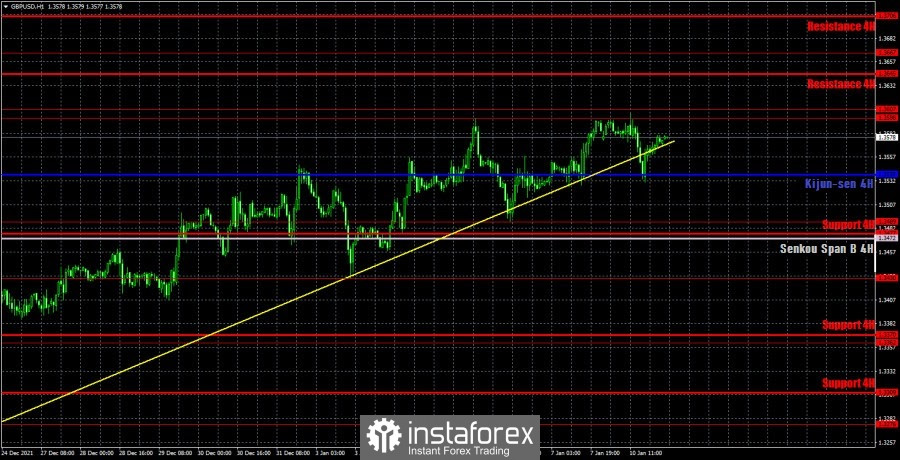
The pound/dollar pair continues its upward movement on the hourly timeframe, although it previously settled below the ascending trend line twice. The level of 1.3598 was also crossed on the third attempt, but at the same time the price managed to go above it by only a couple of dozen points. We are still waiting for a downward correction, but now we should focus only on the extreme levels, since the trend line is no longer relevant. We highlight the following important levels on January 12: 1.3430, 1.3489, 1.3598-1.3607, 1.3667. The Senkou Span B (1.3493) and Kijun-sen (1.3557) lines can also be signal sources. Signals can be "bounces" and "breakthroughs" of these levels and lines. It is recommended to set the Stop Loss level to breakeven when the price passes in the right direction by 20 points. The lines of the Ichimoku indicator can move during the day, which should be taken into account when determining trading signals. No interesting events and publications are scheduled for Wednesday in the UK, but an important inflation report will be published in the US. In principle, this report is the key event of the day, and we believe that a strong market reaction will follow, unless the actual value completely coincides with the forecast.
Explanations for the chart:
Support and Resistance Levels are the levels that serve as targets when buying or selling the pair. You can place Take Profit near these levels.
Kijun-sen and Senkou Span B lines are lines of the Ichimoku indicator transferred to the hourly timeframe from the 4-hour one.
Support and resistance areas are areas from which the price has repeatedly rebounded off.
Yellow lines are trend lines, trend channels and any other technical patterns.
Indicator 1 on the COT charts is the size of the net position of each category of traders.
Indicator 2 on the COT charts is the size of the net position for the non-commercial group.
InstaForex analytical reviews will make you fully aware of market trends! Being an InstaForex client, you are provided with a large number of free services for efficient trading.

