 Stay
Stay 
Trading Conditions
Products
Tools


There was nothing on the macroeconomic calendar yesterday. The only thing that could interest speculators was a series of speeches from the ECB and the FRS. Here, Christine Lagarde once again tried to reassure people with words who are worried about the situation with inflation in the eurozone.
"People can be confident in our commitment to price stability. This is crucial for reliably fixing inflation expectations and confidence in the currency. The new strategy is especially important today, in the context of the period of high inflation that we are currently seeing," Lagarde said on Tuesday.
In turn, the head of the Federal Reserve Bank of Atlanta, Raphael Bostic, said that the central bank may have to raise interest rates as early as March and begin to reduce its balance sheet to contain rising inflation. Bostic also said that the current risks point to a fourth rate hike due to the possibility of higher inflation.
Analysis of trading charts from January 11:
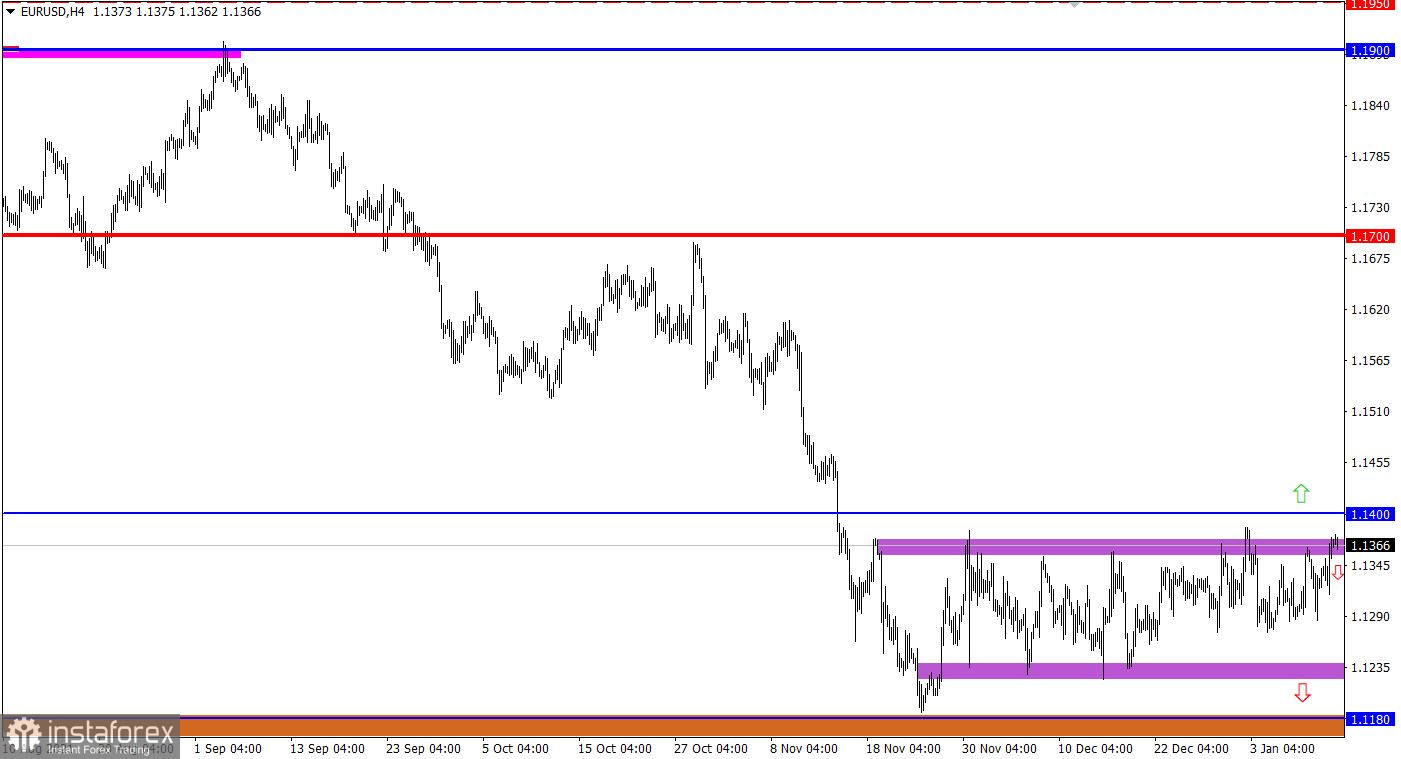
The EUR/USD pair is moving within the upper border of the side channel, while the price has not yet reached the pivot level of 1.1400. Therefore, the possibility of a reduction in the volume of long positions cannot be ruled out.
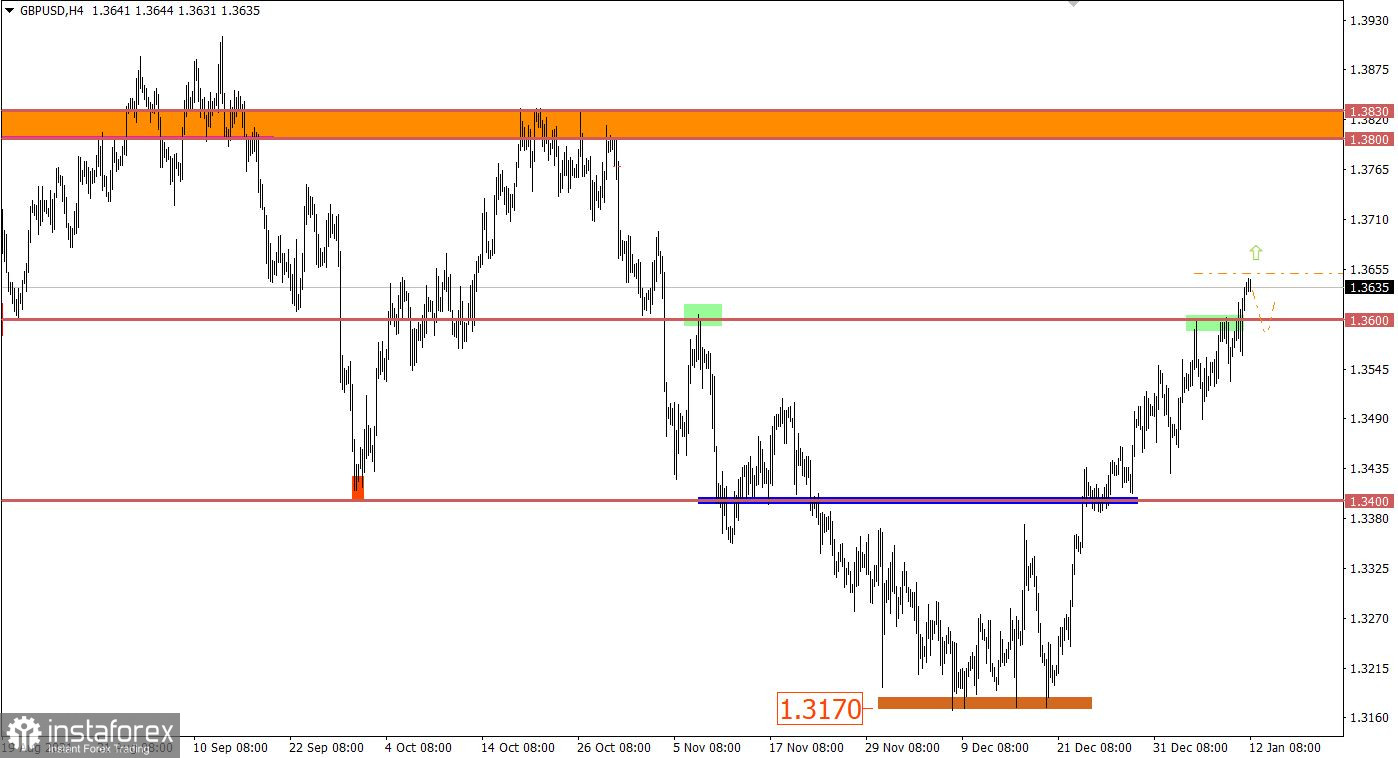
The GBP/USD pair broke through the resistance level of 1.3600 during the upward movement, which resulted in an increase in the volume of long positions and allowed the pound to strengthen, despite its high level of overbought.
On the daily chart, there is a recovery in the value of the pound relative to the decline in June-December of the last year. This process has already reached a scale of 45%, which casts doubt on the downward scenario.
January 12 economic calendar:
All attention today is focused on the US inflation data, where the level of consumer prices may rise from 6.8% to 7.1%. This is a very high inflation level, and it could push the Fed to take unexpected actions, for example, to raise the interest rate in January. It is worth noting that these are only guesses, but speculators may take advantage of the shaky situation in the market.
Time targeting
US Inflation - 13:30 Universal Time
Trading plan for EUR/USD on January 12:
Speculators rule in the short term despite the fact that the medium and long-term signals indicate the purchase of the US dollar. Therefore, all traders' attention is focused on the borders of the flat. The tactics of trading on a rebound are still relevant, which considers the price reversal towards the area of 1.1300-1.1270.
Trading plan for GBP/USD on January 12:
To continue the growth of the pound's value, the quote needs to stay above the level of 1.3650. This step may open the way towards the area of 1.3700-1.3800. Otherwise, a reversal to the level of 1.3600 with subsequent stagnation can be expected.
What is reflected in the trading charts?
A candlestick chart view is graphical rectangles of white and black light, with sticks on top and bottom. When analyzing each candle in detail, you will see its characteristics of a relative period: the opening price, closing price, and maximum and minimum prices.
Horizontal levels are price coordinates, relative to which a stop or a price reversal may occur. These levels are called support and resistance in the market.
Circles and rectangles are highlighted examples where the price of the story unfolded. This color selection indicates horizontal lines that may put pressure on the quote in the future.
The up/down arrows are the reference points of the possible price direction in the future.
InstaForex analytical reviews will make you fully aware of market trends! Being an InstaForex client, you are provided with a large number of free services for efficient trading.

