 Stay
Stay 
Trading Conditions
Products
Tools


EUR/USD 5M
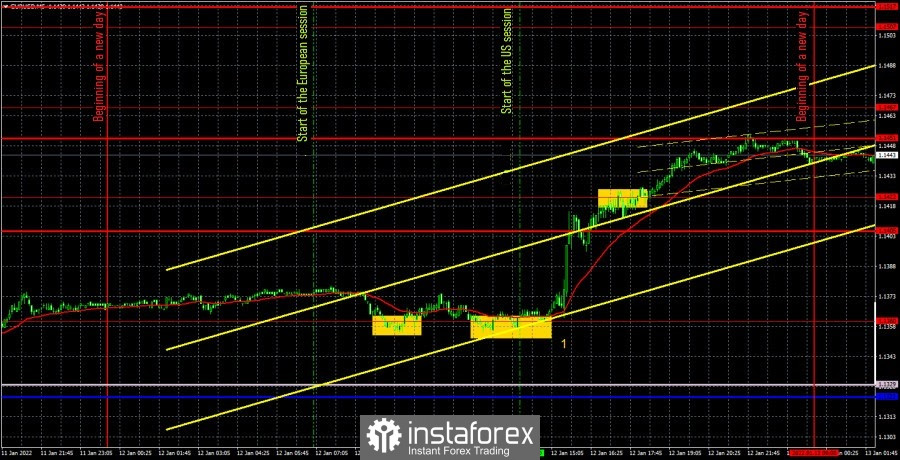
The EUR/USD pair stayed in one place for the most part, however, it began to sharply rise in the afternoon which allowed it to get out of the horizontal channel in which it had been for a month and a half. Of course, it's too early to draw conclusions. The pair can safely return to it tomorrow, as we have already said in the article on fundamental analysis. But still, now everything looks as if the pair will still start the long-awaited upward trend. The upward movement was provoked by a single report – on US inflation. We wrote about it yesterday: it was the most important report of Wednesday. It was not even that important to know what exactly the value of the indicator would be in December. The reaction had to follow, and it did. It's just that this time the dollar did not grow on rising inflation, as it has been repeatedly before. We still have to deal with the technical signals during the day. Actually, it won't take long to understand here, since there were two signals, and they duplicated each other. At first, the pair did not bounce too accurately from the extreme level of 1.1360, then rebounded for the second time and after that grew by 60 points, reaching the next level - the extreme level of 1.1422. Thus, traders had to open long positions on this signal, which should be closed either near the resistance level of 1.1405, or after reaching the level of 1.1422. In any case, a profit of 35 to 55 points was obtained. No deals should have been opened at a signal near the level of 1.1422, since it was already evening, and in intraday trading, we do not recommend postponing transactions to the next day.
We recommend you to familiarize yourself:
Overview of the EUR/USD pair. January 13. The market did not appreciate Jerome Powell's speeches.
Overview of the GBP/USD pair. January 13. Inflation in the US has risen again. Boris Johnson's apologies for the lockdown party.
Forecast and trading signals for GBP/USD for January 13. Detailed analysis of the movement of the pair and trade deals.
EUR/USD 1H
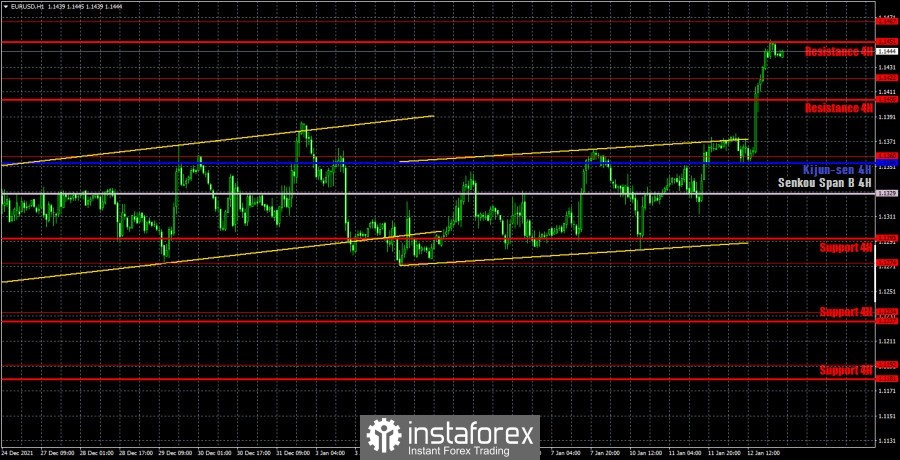
The pair finally left the horizontal channel on the hourly timeframe, and also settled above the formal ascending channel. Thus, for the first time in a long time, the pair gets an excellent opportunity to form a new upward trend, which we have been waiting for during the second half of 2021. If our calculation is correct, then all the factors that contributed to the dollar's growth have already been repeatedly worked out by the markets. Therefore, now - growth. We allocate the following levels for trading on Thursday - 1.1360, 1.1422, 1.1467, as well as the Senkou Span B (1.1329) and Kijun-sen (1.1354) lines. The lines of the Ichimoku indicator may change their position during the day, which should be taken into account when searching for trading signals. Signals can be "bounces" and "breakthroughs" of these levels and lines. Do not forget about placing a Stop Loss order at breakeven if the price went in the right direction of 15 points. This will protect against possible losses if the signal turns out to be false. No important macroeconomic events are planned either in the United States or in the European Union on January 13. There will be only minor publications, such as the producer price index in the United States or the number of applications for unemployment benefits. They are unlikely to cause at least some reaction of the market, except for a movement of 10-20 points.
Explanations for the chart:
Support and Resistance Levels are the levels that serve as targets when buying or selling the pair. You can place Take Profit near these levels.
Kijun-sen and Senkou Span B lines are lines of the Ichimoku indicator transferred to the hourly timeframe from the 4-hour one.
Support and resistance areas are areas from which the price has repeatedly rebounded off.
Yellow lines are trend lines, trend channels and any other technical patterns.
Indicator 1 on the COT charts is the size of the net position of each category of traders.
Indicator 2 on the COT charts is the size of the net position for the non-commercial group.
InstaForex analytical reviews will make you fully aware of market trends! Being an InstaForex client, you are provided with a large number of free services for efficient trading.


