 Stay
Stay 
Trading Conditions
Products
Tools


EUR/USD 5M
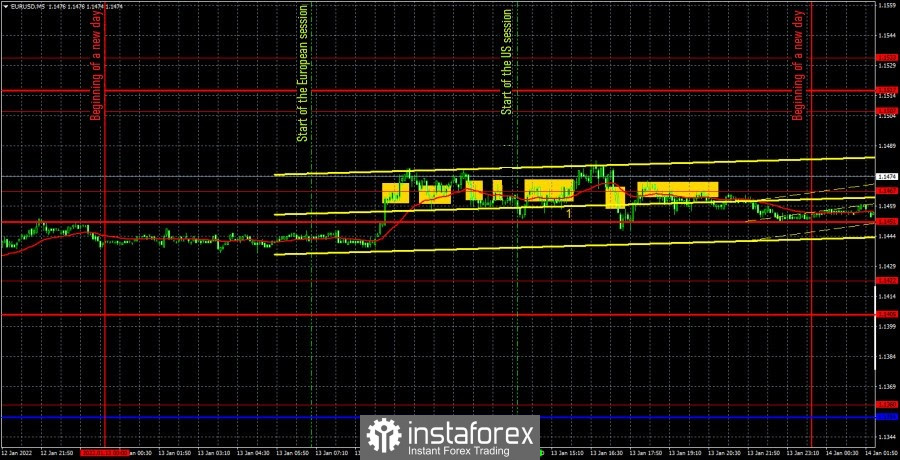
The EUR/USD pair showed an almost perfect flat on Thursday. An upward trend movement was observed only for an hour during the European trading session, and the rest of the time the pair moved in a very narrow sideways range. Unfortunately, all trading signals were formed during the flat, so they did not bring the expected profit. There were no important macroeconomic statistics during the day either in the United States or in the European Union. The producer price index and the number of applications for unemployment benefits were published in the US, but these are not the data that could cause a strong market reaction. We warned traders about this yesterday. Thus, it remains only to say that all trading signals were formed around the same level - the extreme of 1.1467. The fact that they were all near this level speaks for itself: the pair was in the flat. Thus, the trading strategy was extremely simple on Thursday. Traders could try to work out the first two trading signals, since at that time everything looked as if the euro currency would continue to grow. Both signals closed at a loss, since the price could not go in the right direction either for the first or the second time, even 15 points, which would have been enough to set the Stop Loss to zero. After that, all other signals should be ignored. The situation has not changed in the US session, although it is often in the afternoon that the pair moves more actively.
EUR/USD 1H
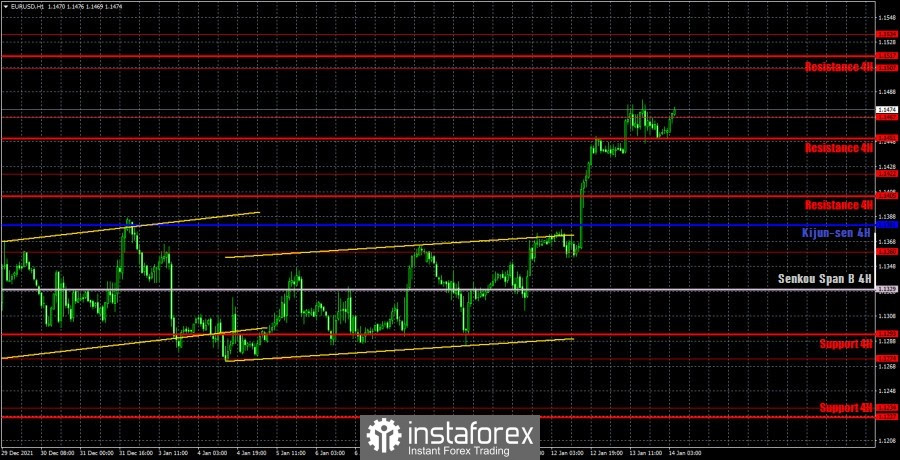
The technical picture is encouraging on the hourly timeframe. After all, after spending a month and a half in the horizontal channel, the price left it, and the flat movement of the environment may be a coincidence (an empty calendar of macroeconomic events). So far, we still expect the euro's succeeding growth, although at the moment there is neither a trend line nor an ascending channel. The movement started too abruptly and unexpectedly, when most market participants expected the pair to fall. We allocate the following levels for trading on Friday – 1.1360, 1.1422, 1.1467, 1.1507, 1.1534, as well as the Senkou Span B (1.1329) and Kijun-sen (1.1381) lines. The lines of the Ichimoku indicator may change their position during the day, which should be taken into account when searching for trading signals. Signals can be "bounces" and "breakthroughs" of these levels and lines. Do not forget about placing a Stop Loss order at breakeven if the price went in the right direction of 15 points. This will protect against possible losses if the signal turns out to be false. European Central Bank President Christine Lagarde will speak in the European Union on January 14, however, as last time, there is little chance that she will tell the markets anything important. A fairly important retail sales report for December will be published in the United States, but the reaction to it will follow only if the actual value is very different from the forecast. A report on industrial production and a consumer sentiment index from the University of Michigan will also be published. You can pay attention to them.
Explanations for the chart:
Support and Resistance Levels are the levels that serve as targets when buying or selling the pair. You can place Take Profit near these levels.
Kijun-sen and Senkou Span B lines are lines of the Ichimoku indicator transferred to the hourly timeframe from the 4-hour one.
Support and resistance areas are areas from which the price has repeatedly rebounded off.
Yellow lines are trend lines, trend channels and any other technical patterns.
Indicator 1 on the COT charts is the size of the net position of each category of traders.
Indicator 2 on the COT charts is the size of the net position for the non-commercial group.
InstaForex analytical reviews will make you fully aware of market trends! Being an InstaForex client, you are provided with a large number of free services for efficient trading.


