 Stay
Stay 
Trading Conditions
Products
Tools


Trend analysis (fig. 1).
Today, the price may rebound from the level of 1.3591 (the closing of yesterday's daily candlestick) in order to reach the historical resistance level of 1.3618 (blue dotted line). If it breaks through this level, it is likely to approach the target level of 1.3677, the Fibonacci retracement level of 76.4% (yellow dotted line).
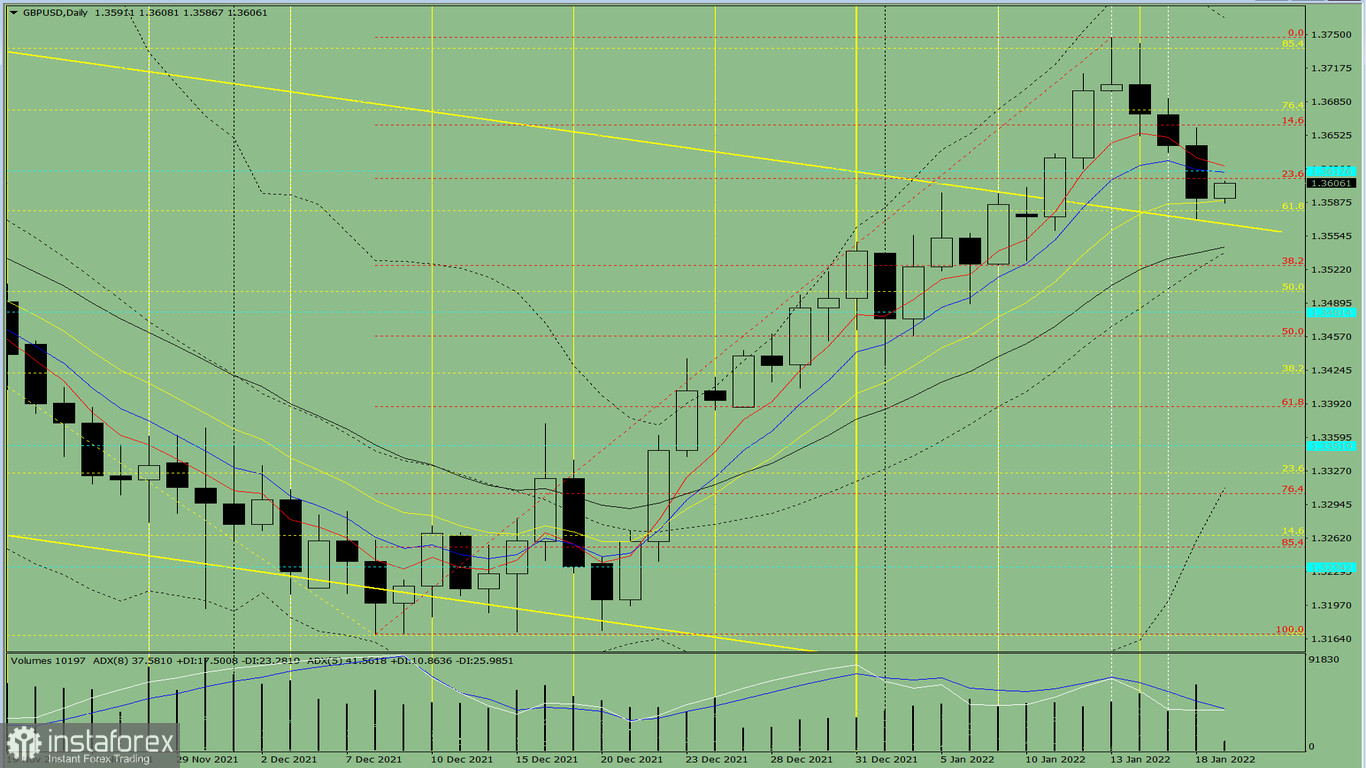
Fig. 1 (daily chart).
Complex analysis:
-indicator analysis– up;
- Fibonacci retracement levels - up;
- trading volumes - up;
- candlestick analysis - up;
- trend analysis - up;
- weekly chart - up;
- Bollinger bands - up.
Conclusion:
Today, the price may rebound from the level of 1.3591 (the closing of yesterday's daily candlestick) in order to reach the historical resistance level of 1.3618 (blue dotted line). If it breaks through this level, it is likely to approach the target level of 1.3677, the Fibonacci retracement level of 76.4% (yellow dotted line).
Alternatively, the price may decline from the level of 1.3591 (the closing of yesterday's daily candlestick) to the Fibonacci retracement level of 38.2%, 1.3526 (red dotted line). After testing this level, it is likely to resume an upward movement.
InstaForex analytical reviews will make you fully aware of market trends! Being an InstaForex client, you are provided with a large number of free services for efficient trading.


