 Stay
Stay 
Trading Conditions
Products
Tools


The UK's inflation data increased from 5.1% to 5.4%, against the expected 5.2%. The acceleration in the pace of consumer prices proves once again that the Bank of England will continue to raise the interest rate.
During the American trading session, the data on the US construction sector was released, where the number of permits issued during the December period increased by 9.1%. At the same time, the volume of construction of new houses rose by 1.4%, when it was forecasted to fall.
The market did not pay attention to the data.
Analysis of trading charts from January 19:
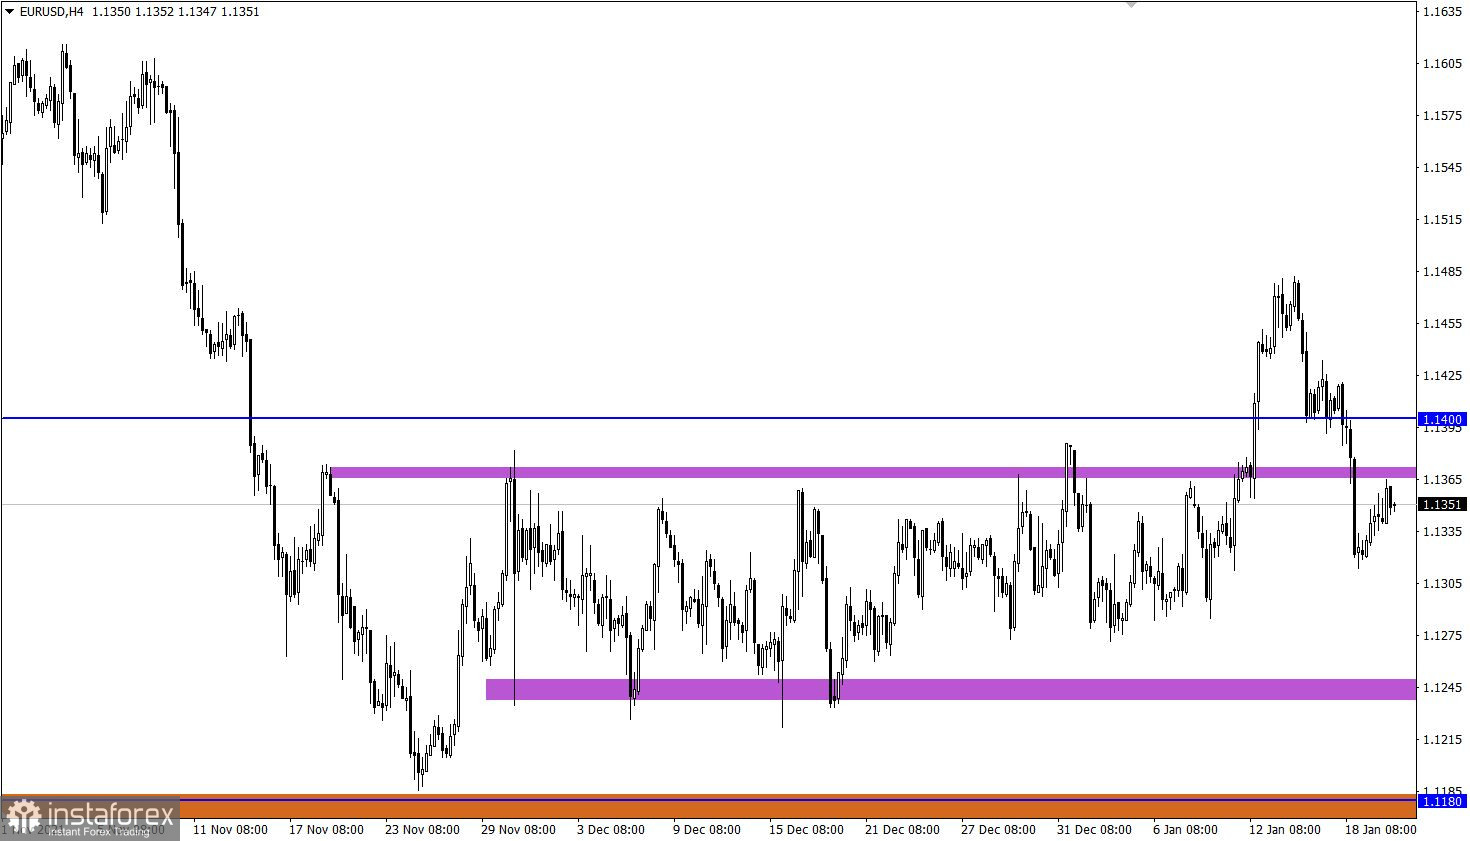
The EUR/USD pair is in a pullback stage after a rapid decline on January 18. The level of 1.1315 serves as a variable pivot point, where an upward movement of about 50 points occurred. In this situation, the price returned to the borders of the previously broken side channel of 1.1230/1.1370.
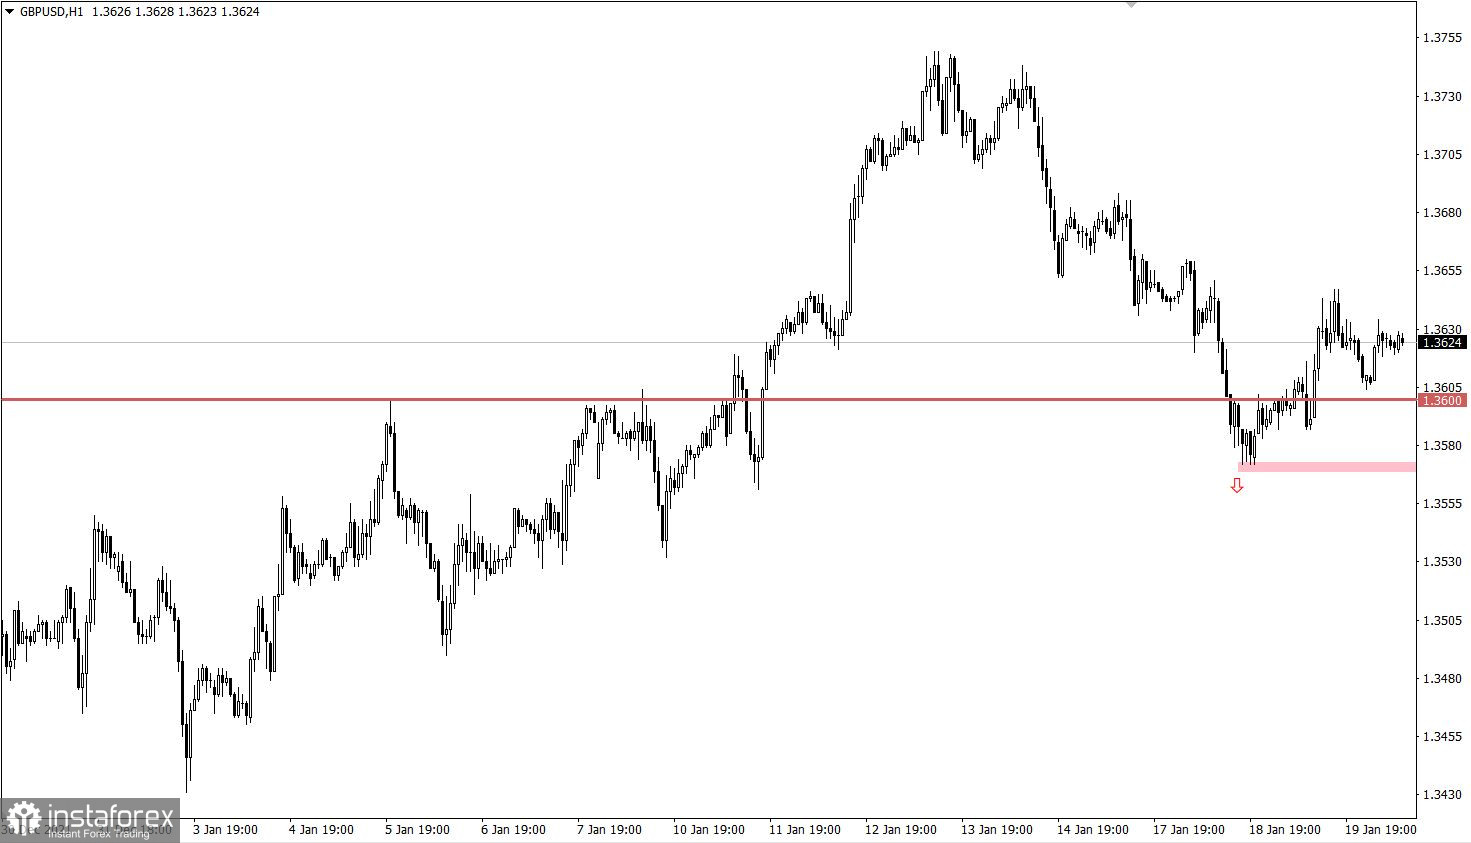
The GBP/USD pair slowed down its decline within the level of 1.3600, which led to a pullback at the beginning, then to a stagnation just above the control level. Despite the scale of the pound's weakness from January 14-18, it is still at the peak of the upward cycle. Therefore, it is impossible to certainly say a change in trade interests.

January 20 economic calendar:
The EU's inflation data will be released today, where the consumer prices are expected to rise from 4.9% to 5.0%. It is worth considering that the data has already been included in the price due to the preliminary estimate, which reflected inflation growth to 5.0%. The reaction of speculators will arise only in the event of a divergence of indicators.
During the US trading session, weekly data on applications for unemployment benefits in the United States will be published, where a slight increase in their volume is forecast.
Statistics details:
The volume of initial applications for benefits may decrease from 230 thousand to 220 thousand
The volume of repeated applications for benefits may increase from 1,559 thousand to 1,580 thousand.
The statistics are neutral in this ratio, but if we see a stronger change in the overall indicator, then a speculative price surge may occur.
Time targeting
EU inflation - 10:00 Universal time
Applications for US unemployment benefits - 13:30 Universal time
Trading plan for EUR/USD on January 20:
In this situation, the level of 1.1370 may act as a resistance, increasing interest in short positions. This signal will be confirmed if the price does not hold above it. In this case, the chance of the quote returning to the variable pivot point of 1.1315 will increase.
Traders will only consider an alternative scenario after holding the price above the level of 1.1400.
Trading plan for GBP/USD on January 20:
In this situation, stagnation along the level of 1.3600 may persist in the market, which will lead to the subsequent formation of a short-term side channel of 1.3590/1.3655.
At the same time, the prolongation of the downward cycle will be considered only after holding the price below the level of 1.3570.
What is reflected in the trading charts?
A candlestick chart view is graphical rectangles of white and black light, with sticks on top and bottom. When analyzing each candle in detail, you will see its characteristics of a relative period: the opening price, closing price, and maximum and minimum prices.
Horizontal levels are price coordinates, relative to which a stop or a price reversal may occur. These levels are called support and resistance in the market.
Circles and rectangles are highlighted examples where the price of the story unfolded. This color selection indicates horizontal lines that may put pressure on the quote in the future.
The up/down arrows are the reference points of the possible price direction in the future.
InstaForex analytical reviews will make you fully aware of market trends! Being an InstaForex client, you are provided with a large number of free services for efficient trading.


