 Stay
Stay 
Trading Conditions
Products
Tools


EUR/USD 5M
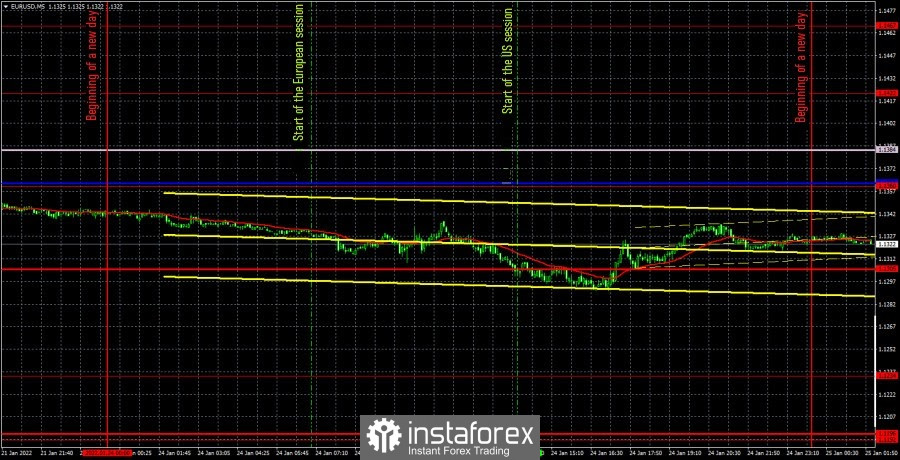
The EUR/USD pair was trading with low volatility again on Monday. It passed only 55 points from the low to the high. Moreover, some macroeconomic statistics were still available on Monday. In particular, business activity indices, which have a fairly high value in the conditions of the next wave of the pandemic. Those from the European Union turned out to be contradictory, as business activity in the manufacturing sector increased from 58.0 to 59.0 points, and in the service sector decreased from 53.1 to 51.2 points. In America, everything was more unambiguous, as both indices turned out to be worse than the December values. Nevertheless, the markets cheerfully ignored the European statistics and reacted with 30 points to statistics from overseas. In any case, the price changes of the euro/dollar pair turned out to be minimal. Thus, in general, the downward trend continues, and we believe that the pair has excellent chances of falling at least to the level of 1.1230. There is no talk about the 1.1230-1.1360 horizontal channel right now, since there is no confirmation that the pair will be in it for a certain time. The price just dropped into the specified range, which may be a coincidence. As for Monday's trading signals, there were none. Partly due to weak volatility, partly due to the fact that the nearest extreme levels and lines of the Ichimoku indicator were far from the price. One way or another, but during the day the price never reached any of them.
We recommend to familiarize yourself with:
Overview of the EUR/USD pair. January 25. Geopolitics, the Fed, global market crashes.
Overview of the GBP/USD pair. January 25. The British pound is falling due to geopolitics and the possibility of more Fed rate hikes in 2022.
Forecast and trading signals for GBP/USD on January 25. Detailed analysis of the movement of the pair and trading transactions.
EUR/USD 1H
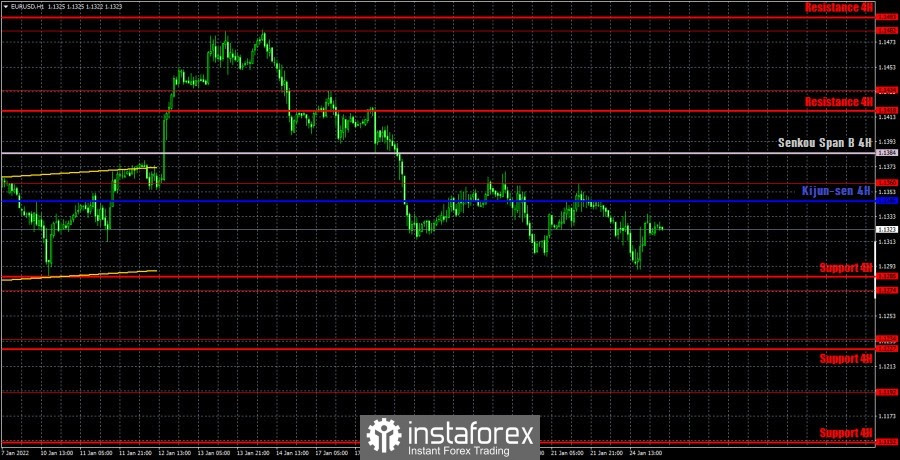
The technical picture on the hourly timeframe remains quite complex. The price returned to the horizontal channel with an upper limit of 1.1360 and a lower limit of 1.1234(1.1274). Thus, the quote may continue to fall, as it has pushed off from the upper limit of this channel. But even if this is not the case, we are still waiting for the pair to fall further, since in this case the trend is now downward. We believe that the price has in some way "picked up speed" before a new attempt to overcome the level of 1.1234, near which it has been for a long time. On Tuesday, we allocate the following levels for trading - 1.1234, 1.1274, 1.1360, 1.1434, as well as the Senkou Span B (1.1384) and Kijun-sen (1.1346) lines. The lines of the Ichimoku indicator may change their position during the day, which should be taken into account when searching for trading signals. Signals can be "bounces" and "breakthroughs" of these levels and lines. Do not forget about placing a Stop Loss order at breakeven if the price went in the right direction of 15 points. This will protect you against possible losses if the signal turns out to be false. On January 25, no important events or publications are planned in the European Union. Only one indicator of consumer confidence will be released in the United States, which can provoke a pair movement if its actual value is very different from the forecast (111.9). However, in any case, we are talking about 20-30 points of movement, no more. Thus, tomorrow the macroeconomic background will be weak, and the pair may continue to slide to the level of 1.1230.
Explanations for the chart:
Support and Resistance Levels are the levels that serve as targets when buying or selling the pair. You can place Take Profit near these levels.
Kijun-sen and Senkou Span B lines are lines of the Ichimoku indicator transferred to the hourly timeframe from the 4-hour one.
Support and resistance areas are areas from which the price has repeatedly rebounded off.
Yellow lines are trend lines, trend channels and any other technical patterns.
Indicator 1 on the COT charts is the size of the net position of each category of traders.
Indicator 2 on the COT charts is the size of the net position for the non-commercial group.
InstaForex analytical reviews will make you fully aware of market trends! Being an InstaForex client, you are provided with a large number of free services for efficient trading.


