 Stay
Stay 
Trading Conditions
Products
Tools


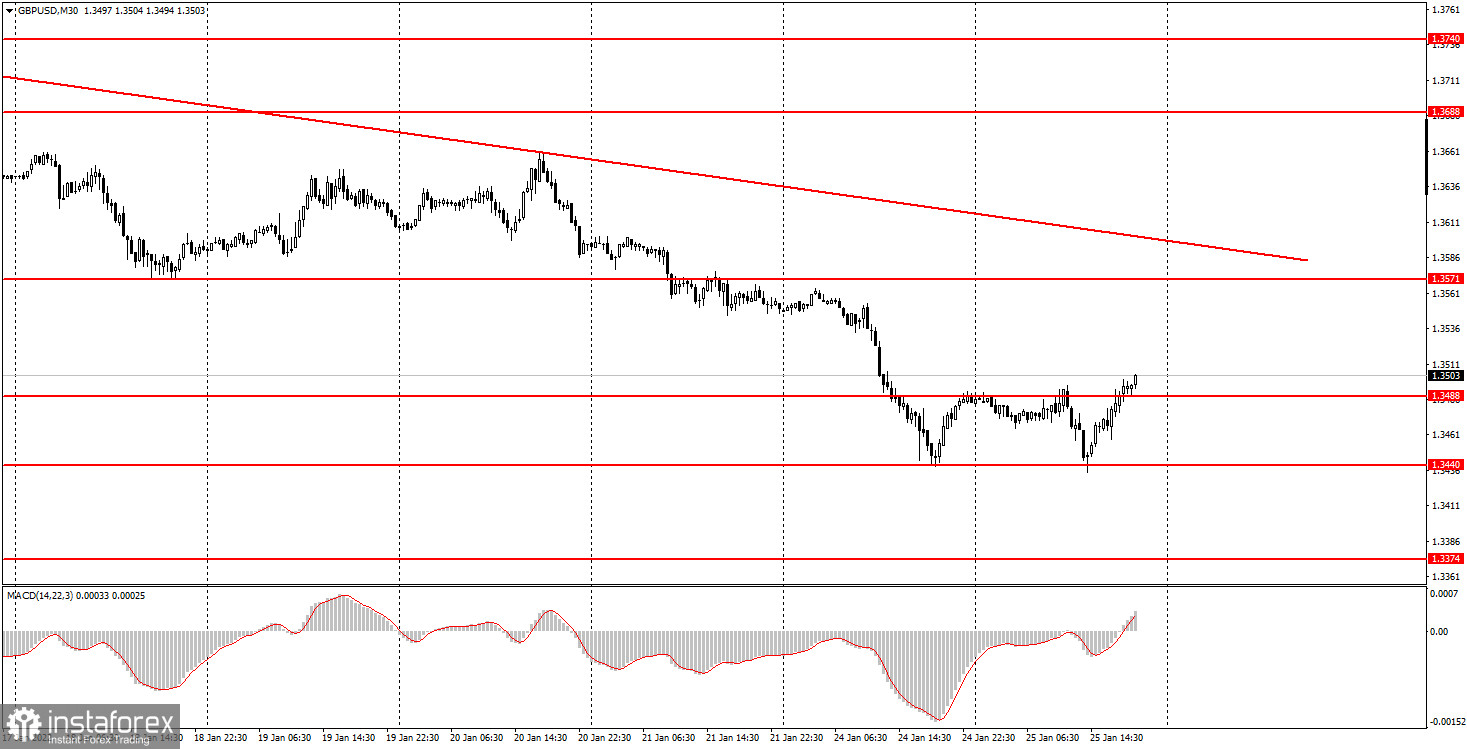
On Wednesday, January 26th, GBP/USD was barely moving. There were some slight changes in the EUR/USD rate, but the cable was stuck in a narrow range. The intraday volatility was limited to 30 pips. Though GBP/USD was fluctuating between 1.3488 and 1.3521, it managed to touch one of these levels only once. As seen on the 30M time frame, the price was above 1.3488 during the day. At the same time, the downward trend line remains valid, so a downward movement may resume at any moment. However, anything can happen today, as the Federal Reserve is scheduled to announce the results of its monetary policy meeting. Naturally, this event is likely to have a great impact on the US dollar. For now, we can only conclude that the downward trend remains intact. The Fed's statement should be extremely dovish to push the GBP/USD pair above the trend line.
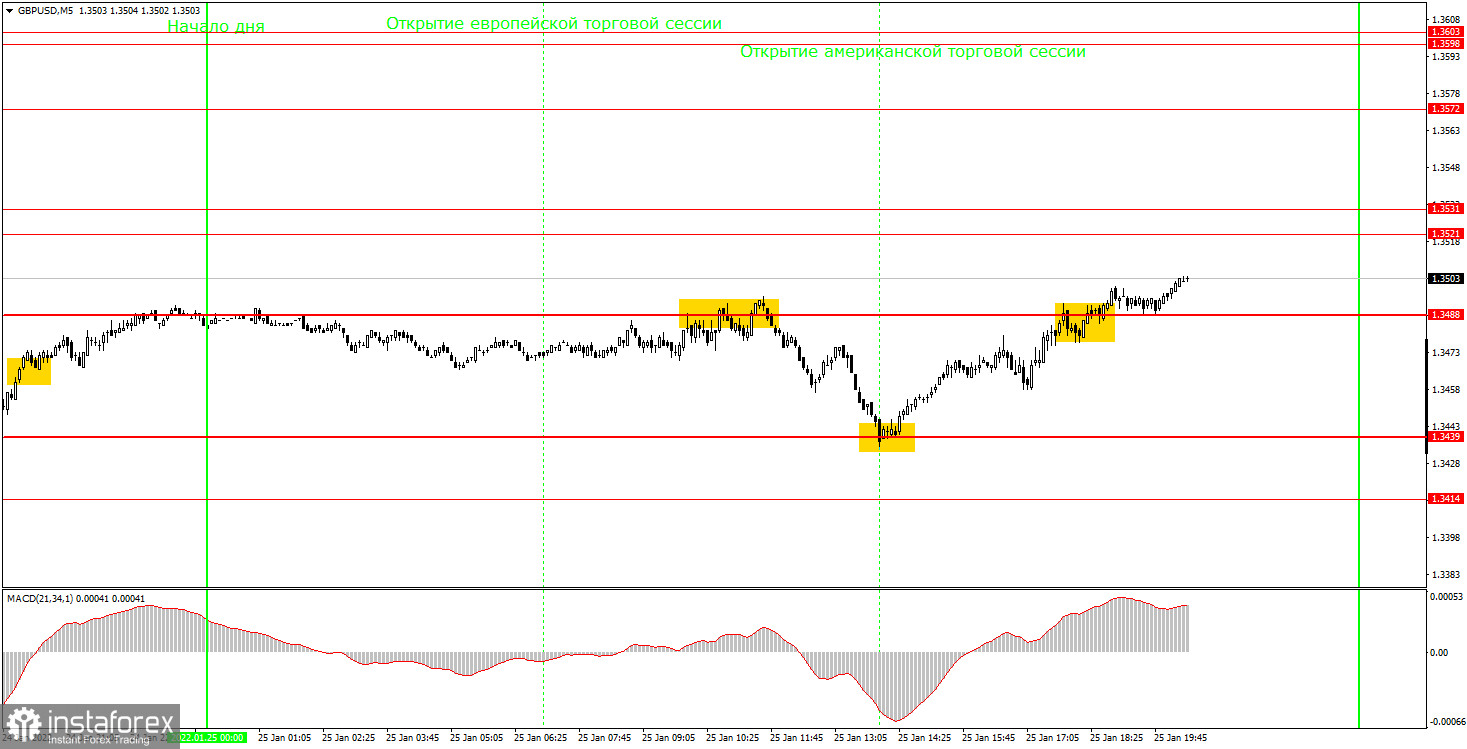
The 5M time frame shows that GBP/USD moved between 1.3488 and 1.3521 on Wednesday. In other words, we witnessed a flat trend with the volatility of just 30 pips. The pair was trading in a sideways channel, but it managed to break one of its boundaries only once. In particular, it rebounded from 1.3521 in the late European session. Interestingly, it was a rather strong SELL signal that could be followed by opening a short position. Still, the pair was able to move by only 20 pips after the signal. So, there were two options: either to set a Stop Loss at a breakeven level or close a trade manually at 1.3488. Actually, there was no clear rebound from this level. All we have to do now is wait for the FOMC statement. After that, the pair may move by decent 100-200 pips from the current levels.
On the 30M time frame, GBP/USD continues correcting after two rebounds from 1.3440. However, the situation may change drastically at the end of Wednesday. Before the FOMC statement, the bias remained downward. The post-meeting trend is hard to predict. The regulator is unlikely to hike the interest rate, but it may reduce the QE program. It will be a hawkish decision that may provide support to the US dollar. On the 5M time frame, I set the key levels for tomorrow at 1.3366, 1.3414, 1.3439, 1.3488, 1.3521-1.3531, and 1.3572. The United Kindom will not publish any significant reports while the United States will release the GDP data for the fourth quarter. This report usually has a significant impact on the American currency.
1) The strength of the signal depends on the time period during which the signal was formed (a rebound or a break)/ The shorter this period, the stronger the signal.
2) If two or more trades were opened at some level following false signals, i.e. those signals that did not lead the price to Take Profit level or the nearest target levels, then any consequent signals near this level should be ignored.
3) During the flat trend, any currency pair may form a lot of false signals or do not produce any signals at all. In any case, the flat trend is not the best condition for trading.
4) Trades are opened in the time period between the beginning of the European session and until the middle of the American one when all deals should be closed manually.
5) We can pay attention to the MACD signals in the 30M time frame only if there is good volatility and a definite trend confirmed by a trend line or a trend channel.
6) If two key levels are too close to each other (about 5-15 pips), then this is a support or resistance area.
Support and Resistance price levels can serve as targets when buying or selling. You can place Take Profit levels near them.
Red lines are channels or trend lines that display the current trend and show which direction is better to trade.
The MACD indicator (14,22,3) is a histogram and a signal line showing when it is better to enter the market when they cross. This indicator is better to be used in combination with trend channels or trend lines.
Important speeches and reports that are always reflected in the economic calendars can greatly influence the movement of a currency pair. Therefore, during such events, it is recommended to trade as carefully as possible or exit the market in order to avoid a sharp price reversal against the previous movement.
Beginning traders should remember that every trade cannot be profitable. The development of a reliable strategy and money management are the key to success in trading over a long period of time.
InstaForex analytical reviews will make you fully aware of market trends! Being an InstaForex client, you are provided with a large number of free services for efficient trading.


