empty
 
 
You are about to leave
www.instaforex.eu >
a website operated by
INSTANT TRADING EU LTD
Open Account

09.12.202218:23 Forex Analysis & Reviews: Technical analysis on Ford stock price.

This information is provided to retail and professional clients as part of marketing communication. It does not contain and should not be construed as containing investment advice or investment recommendation or an offer or solicitation to engage in any transaction or strategy in financial instruments. Past performance is not a guarantee or prediction of future performance. Instant Trading EU Ltd. makes no representation and assumes no liability as to the accuracy or completeness of the information provided, or any loss arising from any investment based on analysis, forecast or other information provided by an employee of the Company or otherwise. Full disclaimer is available here.

Exchange Rates 09.12.2022 analysis

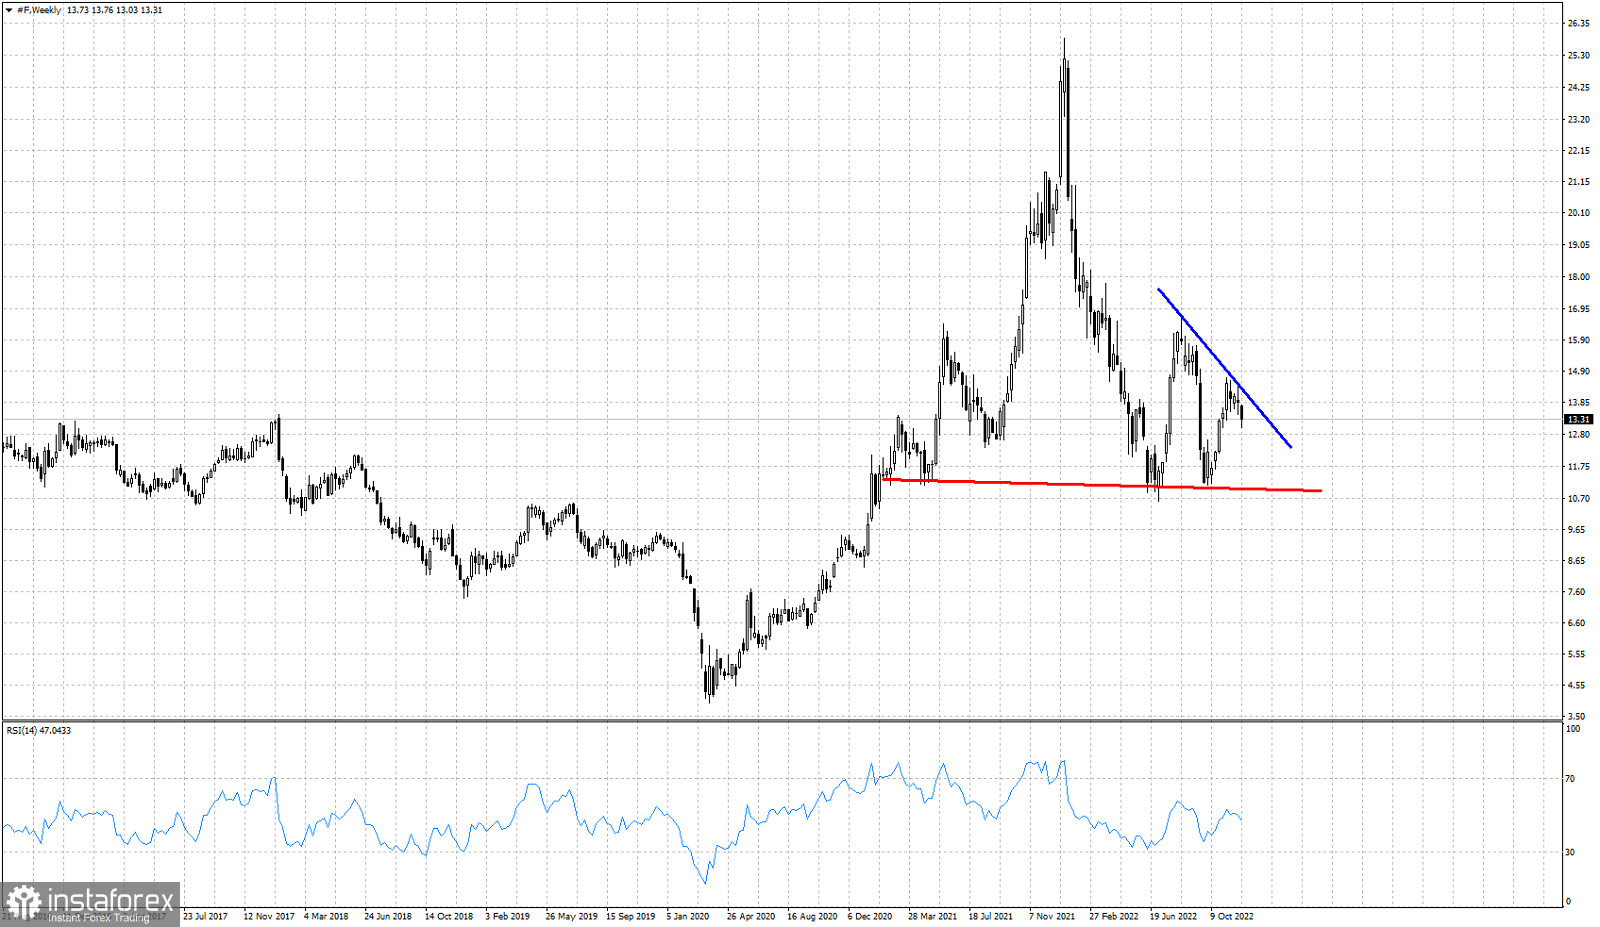
Red line- neckline- support

Blue line- short-term resistance trend line

Ford stock price continues to respect the key neckline support around $11, but the bounce that followed the recent low at $11.13 was weaker than the previous one and provided a lower high. The Head and Shoulders pattern remains in play and the recent lower high increases the chances of breaking the neckline support. At $14.30 we find short-term resistance by the downward sloping trend line. A break above this resistance trend line would be good news for bulls. As long as price is below this trend line, we expect F stock price to move lower to test once again the neckline support around $11.

Alexandros Yfantis
Analytical expert of InstaForex
© 2007-2024

Open trading account

InstaForex analytical reviews will make you fully aware of market trends! Being an InstaForex client, you are provided with a large number of free services for efficient trading.


You are now leaving www.instaforex.eu, a website operated by INSTANT TRADING EU LTD
Can't speak right now?
Ask your question in the chat.

Turn "Do Not Track" off