 Stay
Stay 
Trading Conditions
Products
Tools


In my forecast this morning, I drew your attention to the level of 1.0533 and recommended entering the market from it. Let's have a look at the 5-minute chart and analyze what happened. The pair declined toward 1.0533, but the price did not manage to reach it. For this reason, there were no signals from 1.0533. Other levels were also missed due to lower volatility, so I did not see any signals to enter the market.
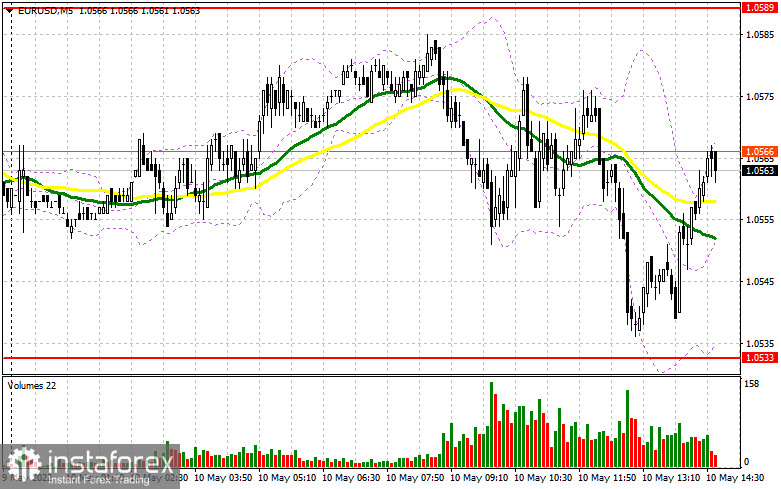
Long positions on EUR/USD:
In the second half of the day, the technical picture and the trading plan did not change at all. Considering that there are no important statistics to be released, it is better to focus on a number of speeches of Fed representatives, who will talk about prospects for inflation and the US economy and may also shed light on how hawkish the central bank will behave in the current environment. In the case of hawkish statements, the pressure on the euro is highly likely to increase and we will see the pair return to the area of crucial support at 1.0533. The pair is likely to form a false breakout at this level, which will give a good entry point to open long positions, counting on bulls regaining control over the market and the subsequent breakthrough above 1.0589. If the FOMC members stick to more dovish rhetoric during their speeches, the pair may break out of the trading range. A breakthrough and a test of 1.0589 will form a new signal for opening long positions, which will support bulls and open the way for a further EUR/USD rise to the area of 1.0638, where traders may lock in profits. The next target is located in the area of 1.0691. If the EUR/USD pair declined and bulls showed weak activity at 1.0533, where the MAs are passing and supporting bulls, the best option to buy the euro would be a false breakout near this year's low at 1.0473. It would also be better to open long positions on a rebound from 1.0426 or lower near 1.0394, allowing an upward intraday correction of 30-35 pips.
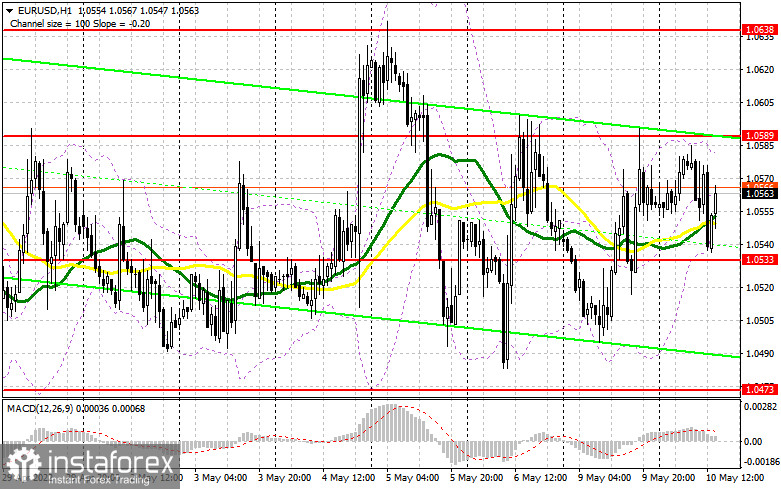
Short positions on EUR/USD:
Bears once again proved to be passive even near the middle of the sideways channel, not to mention the pair returning back to the yearly lows. Much depends today on the statements of FOMC members John Williams and Raphael Bostic. It is also interesting what Loretta Mester, who has a rather soft stance on interest rates, has to say. The best scenario to place short positions is a false breakout at 1.0589, but the pair needs to return to that level at first. A breakthrough and fixation below 1.0533 are more likely to be a sell option. Combined with a reverse test bottom/top, it may create an excellent signal to open short positions, which will trigger some bulls' stop-loss orders and return the downtrend with the prospect of reaching 1.0473, where traders may take profit. The next target is located at 1.0426, but this scenario is possible only after a complete surrender of the euro buyers. If the EUR/USD pair shows growth during the US session and bears appear to be weak at 1.0589, then serious problems may begin. In that case, I expect a sharper upward rush in the pair. The optimal scenario for opening short positions would be a formation of a false breakout near 1.0638. Selling the EUR/USD on the rebound is possible from 1.0691 or higher near 1.0736, allowing a downward correction of 25-30 pips.
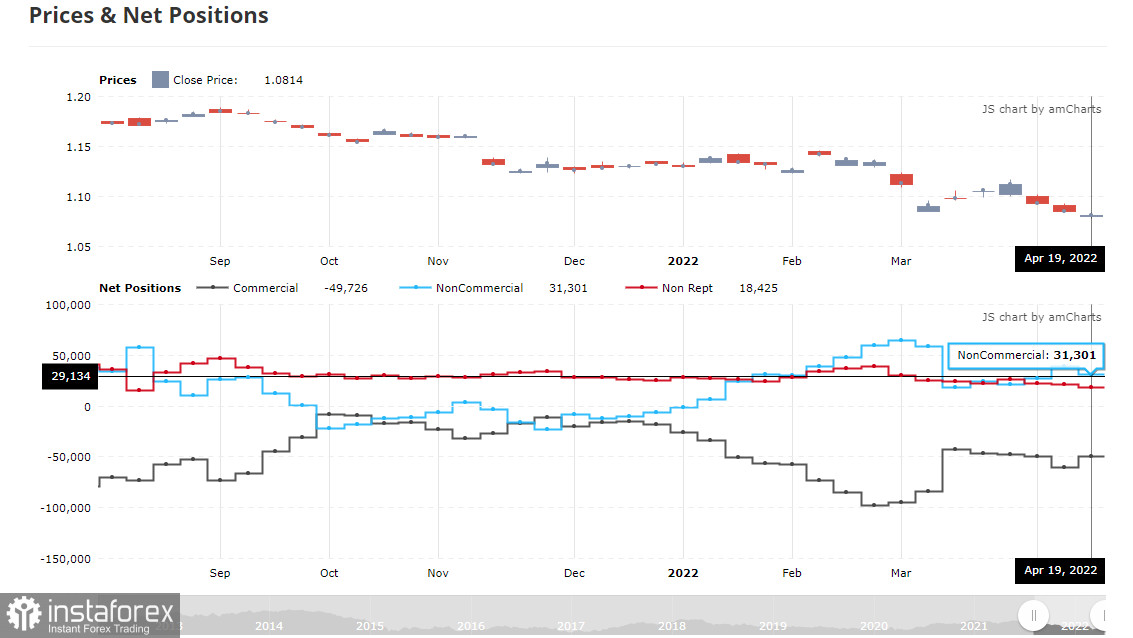
The COT (Commitment of Traders) report for April 19 logged a sharp increase in short positions and a reduction in the long ones. The recent statements of representatives of central banks led to a new sale-off of risk assets, as it became clear to everyone - serious problems in the economies of developed countries this year cannot be avoided. Although the president of the European Central Bank said in her speeches that the regulator planned to fully taper its bond-buying program by the end of Q2 of 2022, hinting at a rate hike in early autumn, it was not enough to support the euro. The Federal Reserve's more aggressive policy was not as hawkish as many had expected, which eased the demand for the US dollar slightly and brought the market back into balance. Another problem is the threat of another economic crisis due to strict quarantine restrictions in China amid a new wave of coronavirus, which has already led to a major disruption in the supply chains of European and Asian countries. The COT report indicated that long non-commercial positions declined to 221,003 from 221,645, while short non-commercial positions rose sharply to 189,702 from 182,585. Notably, the euro's decline makes it more attractive for investors, so the minimal closing of long positions is no surprise. At the end of the week, the total non-commercial net position declined to 34,055 from 39,060. The weekly closing price tumbled to 1.0814 from 1.0855.
InstaForex analytical reviews will make you fully aware of market trends! Being an InstaForex client, you are provided with a large number of free services for efficient trading.

