 Stay
Stay 
Trading Conditions
Products
Tools


Bullish trend still in place
Monday is always a good time to analyze the close of the session on Friday and the results of the previous trading week. As I have mentioned in my previous reviews, the weekly chart is perhaps the best time frame to follow the trading signals that are being generated here. What is more, the weekly chart also provides a quite accurate picture of where the price will move next. So let's start.
Weekly chart
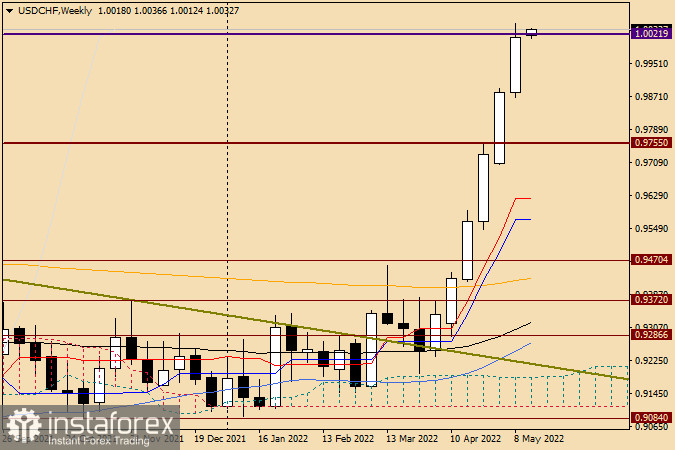
The USD/CHF pair has been posting notable growth for six weeks in a row. As a result, the US dollar has reached parity with the Swiss franc near the benchmark level of 1.0000. Notably, the pair has hit the mark of 1.002, its highest value since November 2019. The level is quite strong which is confirmed by a fall in the quote that took place in 2019. This was the point at which the upside movement of the pair was limited on May 9-13. In general, a trading record shows that it is not the first time when the pair plunges sharply after moving above 1.0000. We shall see how the pair behaves this time. If a reversal candlestick pattern appears on the weekly chart by the end of the week, the above described scenario may be repeated. In any case, USD/CHF is likely to start a correction any time soon as it has been demonstrating impressive growth and approaching parity. However, there are no reversal candlestick patterns on the weekly time frame at the moment.
Daily chart
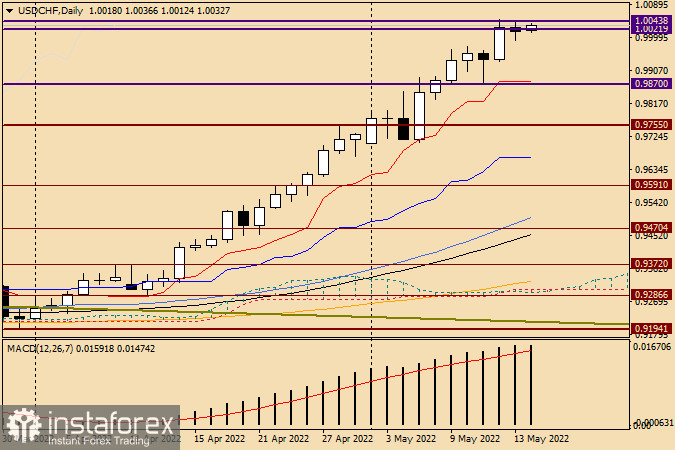
As for the daily chart, we can see the first sign of a reversal there. I'm talking about the Doji candlestick that was formed on Friday, May 13. It clearly demonstrates the strength of the resistance that the usd/chf bulls faced in their attempt to overcome the level of 1.004. If another bearish candlestick appears on the chart and its body is longer, then a corrective pullback to the area of 0.9880-0.9870 is possible. This is where the support zone is located, and the red Tenkan line of the Ichimoku indicator is found slightly above. If this scenario is true, then I recommend opening long positions from the above mentioned price zone. Emerging bullish candlesticks on this or lower time frame will serve as a confirmation signal. Yet, be careful with buying near 1.0000 or slightly above this mark as it seems too risky and the price is too high. On the other hand, if reversal bearish candlestick patterns appear near the parity level, you can try to sell the pair cautiously but with closer goals. The bullish trend is still in place, and going short means going against the trend, which is always risky. Given a very interesting technical picture of the USD/CHF pair, we might return to its analysis later in the week and make some adjustments.
Good luck!
InstaForex analytical reviews will make you fully aware of market trends! Being an InstaForex client, you are provided with a large number of free services for efficient trading.


