 Stay
Stay 
Trading Conditions
Products
Tools


Details of the economic calendar from May 18
UK inflation soared to 9.0%, up from 7.0% in March. Thus, all the efforts of the Bank of England, aimed at combating rising inflation, did not bring any results. This is a negative factor that put pressure on the pound sterling.
Europe's inflation figures diverged from a preliminary estimate of 7.5%. As a result, the consumer price index remained at the level of 7.4%, which may be a signal of a slowdown in inflation. This is a positive factor for the EU economy in the medium term.
Analysis of trading charts from May 18
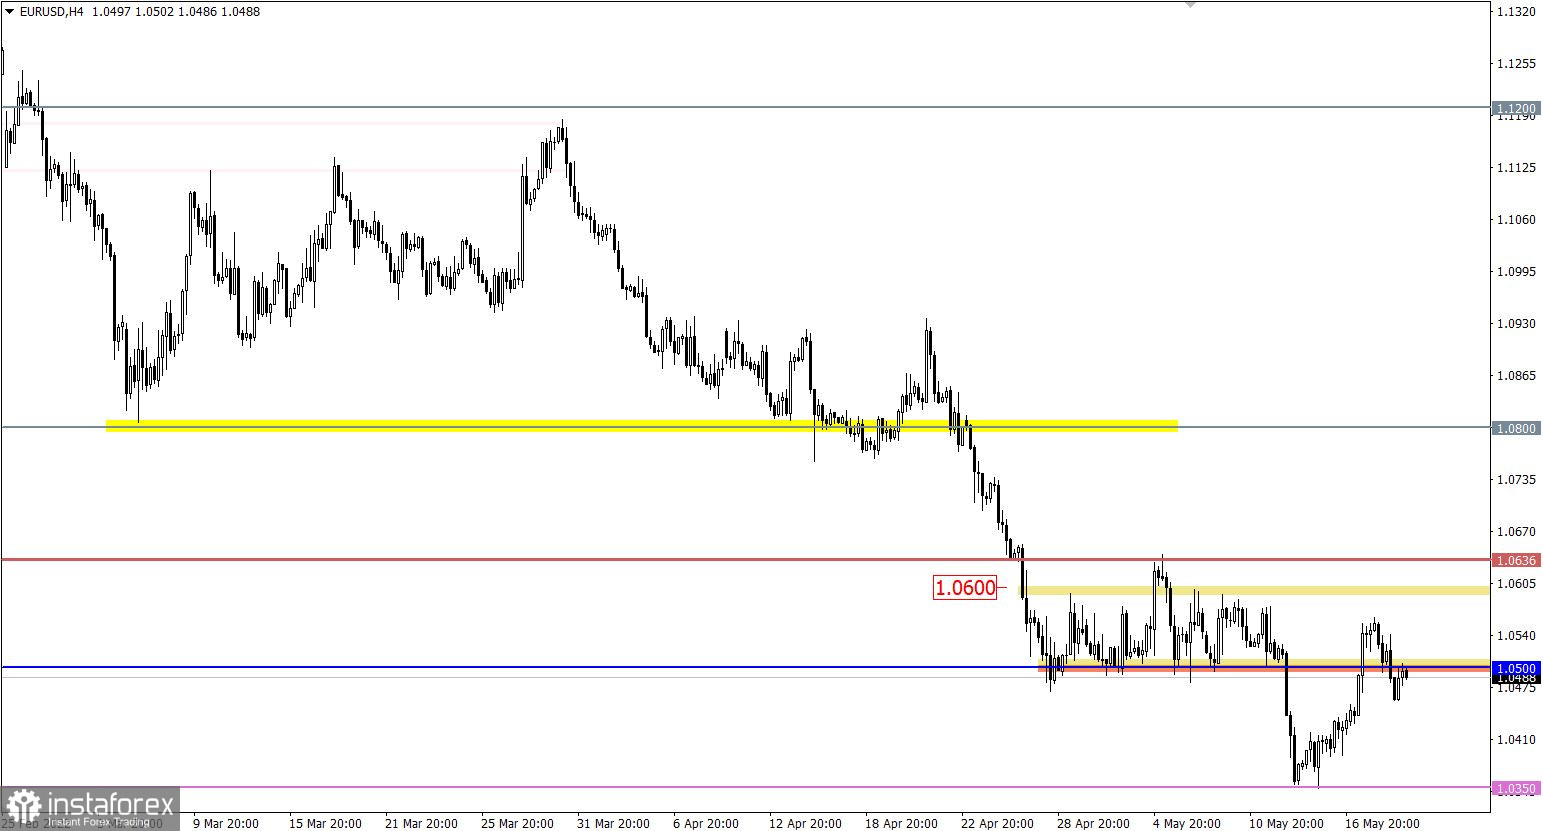
The EURUSD currency pair slowed down the corrective course in the region of 1.0550, where, against the background of local overbought, there was an increase in the volume of short positions in the euro. This led to a reverse move, where the quote rolled back below the 1.0500 level.
On the trading chart of the daily period, there is a corrective move from the local bottom of 2016. This movement fits into the clock component of the medium-term downward trend.
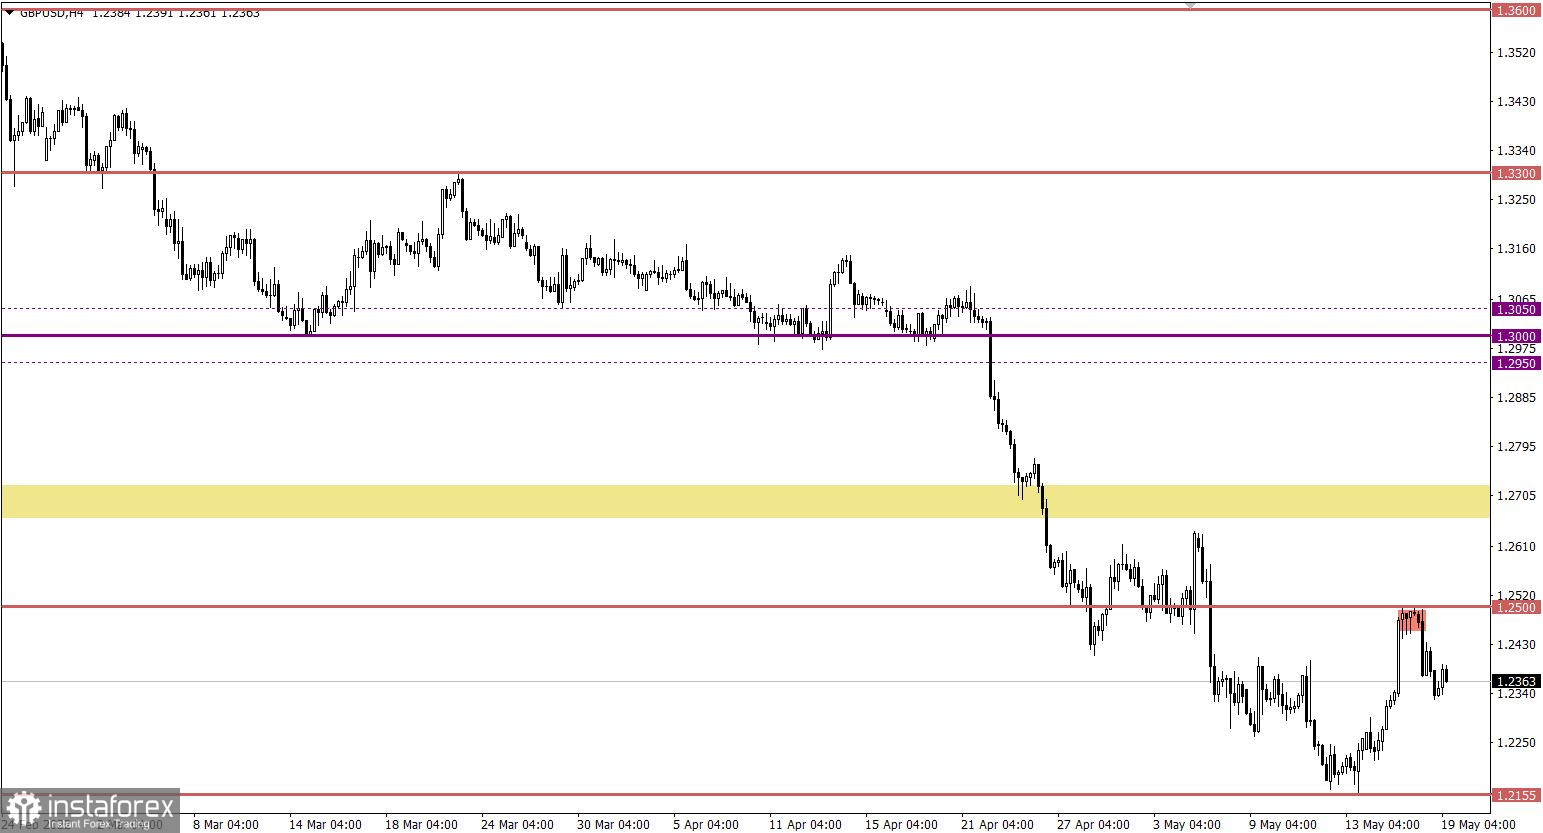
The GBPUSD currency pair rebounded after a short stagnation within the resistance level of 1.2500. This led to an increase in the volume of short positions and, as a result, a partial recovery of the dollar relative to the recent correction.

Economic calendar for May 19
Today, of interest, there are only claims for unemployment benefits in the United States, where they are predicted to decrease in their volume. This is a positive factor for the US labor market.
Statistics details:
The volume of continuing claims for benefits may be reduced from 1.343 million to 1.320 million.
The volume of initial claims for benefits may be reduced from 203,000 to 200,000.
Time targeting
US Jobless Claims - 12:30 UTC
Trading plan for EUR/USD on May 19
In this situation, only a stable holding of the price below the level of 1.0500 can indicate a signal about the completion of the correction. Otherwise, the scenario of variable turbulence within the boundaries of 1.0500/1.0600 will still be relevant on the market.
Trading plan for GBP/USD on May 19
The subsequent increase in the volume of short positions is expected at the time of holding the price below the value of 1.2300 in a four-hour period. This move may lead to further weakening of the pound in the direction of the local bottom on May 13 at 1.2155.
An alternative scenario will be considered by traders if the price returns to the resistance level. So the correction will have a second chance for a prolongation.
What is reflected in the trading charts?
A candlestick chart view is graphical rectangles of white and black light, with sticks on top and bottom. When analyzing each candle in detail, you will see its characteristics of a relative period: the opening price, closing price, and maximum and minimum prices.
Horizontal levels are price coordinates, relative to which a stop or a price reversal may occur. These levels are called support and resistance in the market.
Circles and rectangles are highlighted examples where the price of the story unfolded. This color selection indicates horizontal lines that may put pressure on the quote in the future.
The up/down arrows are the reference points of the possible price direction in the future.
InstaForex analytical reviews will make you fully aware of market trends! Being an InstaForex client, you are provided with a large number of free services for efficient trading.

