 Stay
Stay 
Trading Conditions
Products
Tools


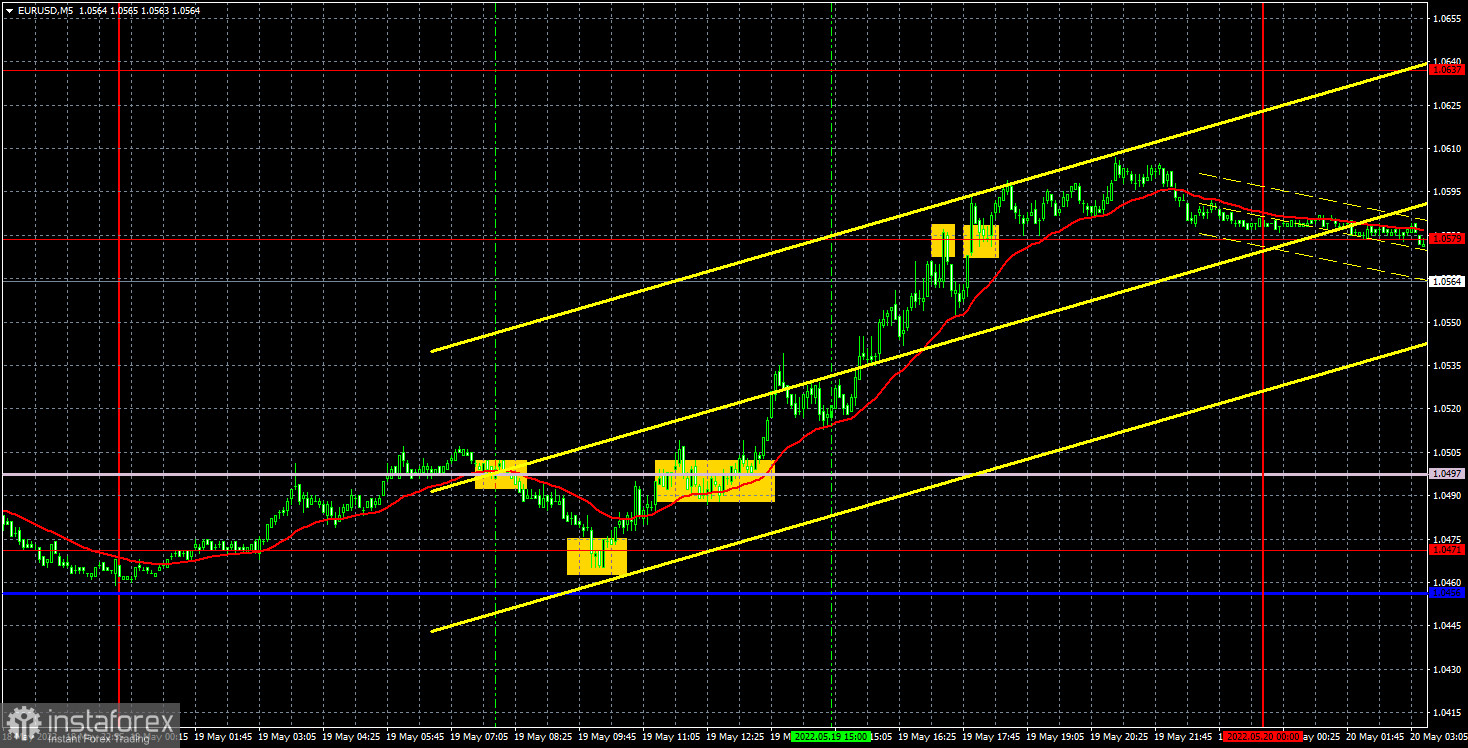
Yesterday, the EUR/USD pair resumed its upward movement and managed to gain 144 points during the day. From our point of view, this is a very strong growth, especially given the fact that there weren't any important macroeconomic statistics yesterday. However, traders still bought the euro during the day, so it seems that the time has come when the euro will be able to significantly correct. We have already said in recent articles that the only factor that really supports the euro now is the technical one. The price cannot move in only one direction all the time. There should be corrections and pullbacks. But in recent weeks and even months there have been practically no corrections, so we believe that now it has begun. Therefore, in the near future, the euro may continue to grow, regardless of the geopolitical, fundamental or macroeconomic background. Recall that not always statistics or news were unambiguously in favor of the dollar. There were moments when they supported the euro, but the dollar grew anyway. Therefore, now the picture may change to the opposite.
For the first time in a long time, a sufficiently large number of "non-flat" signals formed during the day. The first sell signal was formed at the opening of the European session, when the price settled below the Senkou Span B. The pair moved down a bit and has already rebounded from the level of 1.0471, forming a buy signal. Therefore, traders had to close shorts and open longs. Subsequently, the price overcame the Senkou Span B line and rose to the level of 1.0579, from which it initially rebounded. Therefore, shorts should have been opened here, but the signal turned out to be false. And the last buy signal turned out to be weak and did not bring a big profit. As a result, it was possible to earn about 10 points on the first transaction, about 90 points on the second one, a loss of 20 points on the third one, and 0 points on the fourth one.
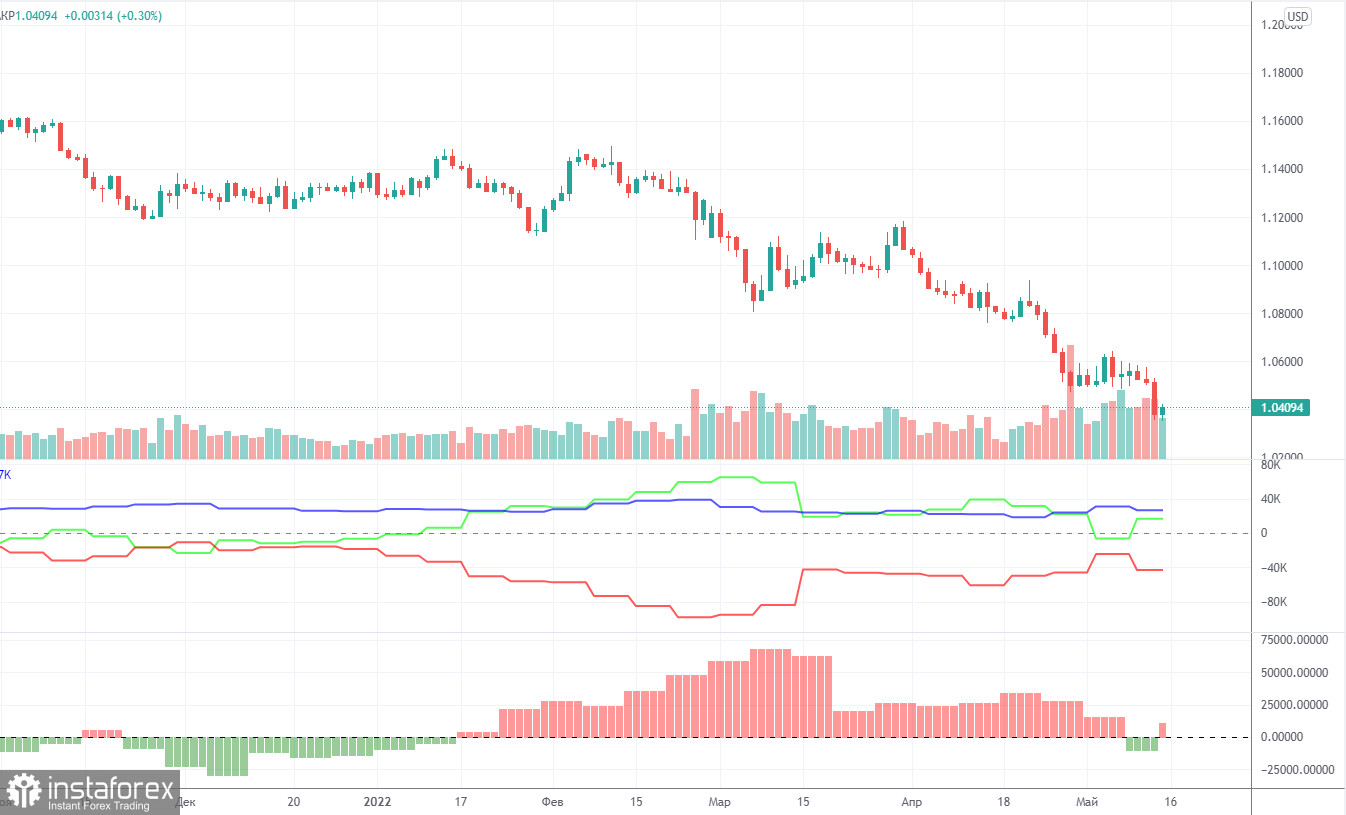
The latest Commitment of Traders (COT) reports on the euro raised more questions than they answered! The week before last, for the first time in a long time, the COT report showed a bearish mood among traders, which is logical, given the euro's strong fall in recent months. However, the new COT report again showed an increase in bullish sentiment! During the reporting week, the number of long positions increased by 19,800, while the number of short positions in the non-commercial group decreased by 3,100. Thus, the net position grew by 23,000 positions per week. This means that the bearish mood has turned to bullish, as the number of longs now exceeds the number of shorts for non-commercial traders by 17,000. As a result, we again have a paradoxical picture in which big players buy more euros than they sell, but at the same time, the euro falls. From our point of view, this is because the demand for the US dollar is much higher than the demand for the euro. Even if someone suggested that the whole point is the weakening of the bullish mood in recent months (the second indicator is a histogram), then we recall that in the week between May 4 and 10, commercial traders opened 20,000 longs, and the euro increased by 30 points over the same period... Thus, it is still impossible to make a correlation between COT reports and what is happening in the market. Forecasts to build on such data, moreover, do not make sense.
Overview of the EUR/USD pair. May 20. The European Union is switching to solar energy, and Hungary continues to block the sixth package of sanctions.
Overview of the GBP/USD pair. May 20. Great Britain and the European Union remembered that they also have their own reason for the conflict.
Forecast and trading signals for GBP/USD on May 20. Detailed analysis of the movement of the pair and trading transactions.
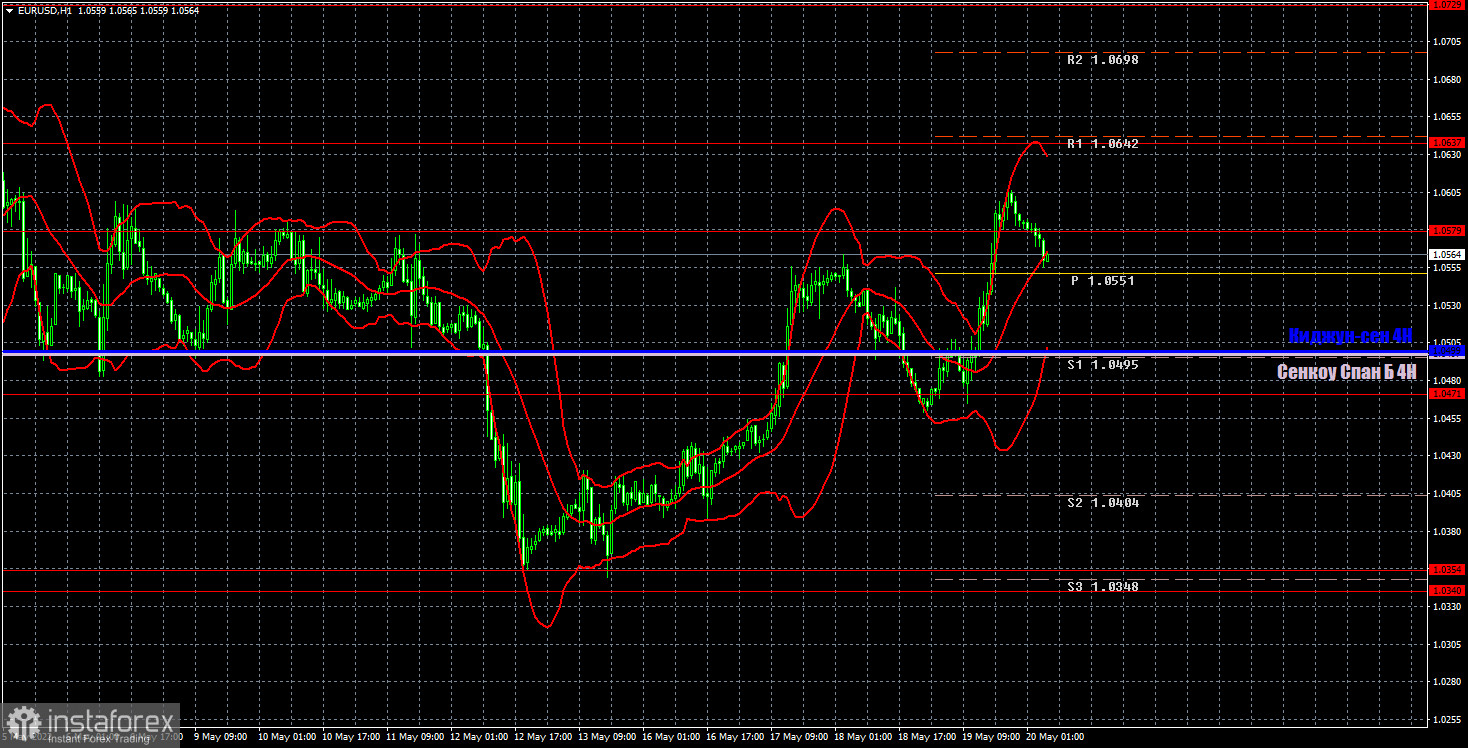
The pair continues a strong upward movement on the hourly timeframe. When was the last time such a thing could be said about the euro? Nevertheless, corrective growth continues and now the question is when will it end, since the foundation, macroeconomics and geopolitics remain for the most part on the side of the US currency. We highlight the following levels for trading on Friday - 1.0340-1.0354, 1.0471, 1.0579, 1.0637, 1.0729, as well as Senkou Span B (1.0497) and Kijun-sen (1 .0499). Ichimoku indicator lines can move during the day, which should be taken into account when determining trading signals. There are also secondary support and resistance levels, but no signals are formed near them. Signals can be "rebounds" and "breakthrough" extreme levels and lines. Do not forget about placing a Stop Loss order at breakeven if the price has gone in the right direction for 15 points. This will protect you against possible losses if the signal turns out to be false. No important events or reports are scheduled for May 20 in the European Union and the United States. Thus, there will be nothing for traders to react to today. However, there was no news yesterday, however, the pair showed volatility of 144 points and a strong trend movement.
Support and Resistance Levels are the levels that serve as targets when buying or selling the pair. You can place Take Profit near these levels.
Kijun-sen and Senkou Span B lines are lines of the Ichimoku indicator transferred to the hourly timeframe from the 4-hour one.
Support and resistance areas are areas from which the price has repeatedly rebounded off.
Yellow lines are trend lines, trend channels and any other technical patterns.
Indicator 1 on the COT charts is the size of the net position of each category of traders.
Indicator 2 on the COT charts is the size of the net position for the non-commercial group.
InstaForex analytical reviews will make you fully aware of market trends! Being an InstaForex client, you are provided with a large number of free services for efficient trading.

