 Stay
Stay 
Trading Conditions
Products
Tools


Hello!
It is time to look at one of the most interesting cross pairs – EUR/GBP. There is certain dependence between EUR/GBP and majors EUR/USD and GBP/USD. Depending on a situation, the way the major pairs move can influence the cross one, and vice versa. So, let's begin with the technical picture of EUR/GBP on the weekly chart.
Weekly
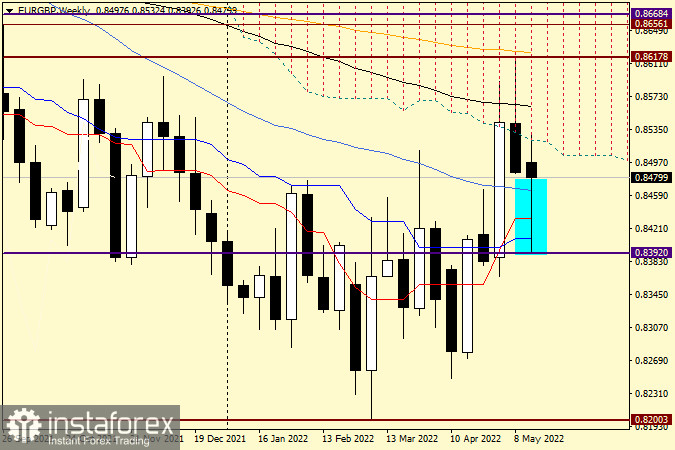
A week ago, the pair's growth stopped at 0.8617 and a reversal occurred. Bulls encountered strong resistance at 0.8600 and even lost control over the market. This week, a bearish candlestick with a very long upper shadow emerged on the chart. The pair then fell below 0.8392. All attempts to break through the strong technical level of 0.8400 failed. The long lower shadow indicates that bulls are actively recouping their losses, which means they are now in control of the market.
If the body of the weekly candlestick does not change, bulls will once again try to enter the range of the Ichimoku cloud and settle in there. However, one big bullish candlestick is not enough for the pair to consolidate in the cloud. Given that the previous candlestick has an extremely long upper shadow, bulls need to break through 0.8617 and 0.8624 (orange EMA 200). In case of fixing above 0.8624, the quote would head towards the strong resistance zone of 0.8656-0.8668. Should the week close below the current low of 0.8392, the pair would go down.
Daily
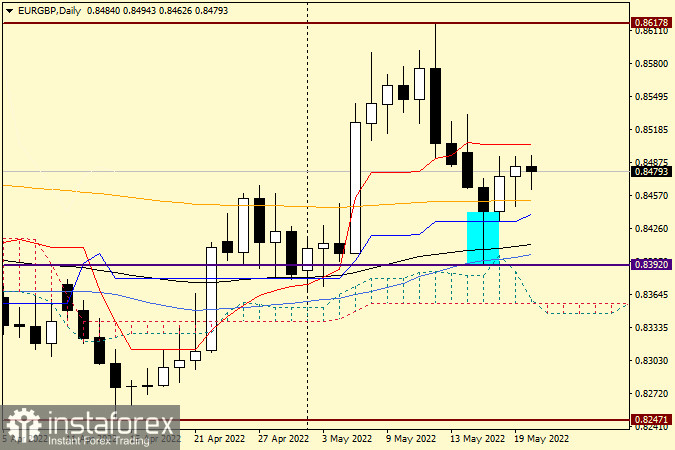
On the daily chart, a number of indicators prevent EUR/GBP from decreasing. Thus, the EMA 200, blue Kijun line, EMA 89 (black), and MA 50 provide support for the pair. Resistance is seen near the important psychological and technical level of 0.8500, in line with the red Tenkan line. Although a bullish candlestick with a relatively long lower shadow emerged on the daily chart yesterday, the price is bearish today. Anyway, the situation in the market can change in the blink of an eye. At this point, both long and short positions could be considered. Yet, it would still be wiser to buy the instrument. This is indicated by a very strong rebound on attempts to break through 0.8400, as well as support provided by EMA 89 and MA 50. Long positions could be opened after the cross pair has risen above 0.8480, with the target around 0.8500. It would be possible to go short from this mark. In light of the current situation, entering the market might not be worth it. After analyzing the technical picture of EUR/USD with an eye to the close of weekly trading and some other aspects on Monday, the positioning of this instrument might get clearer.
Have a nice day!
InstaForex analytical reviews will make you fully aware of market trends! Being an InstaForex client, you are provided with a large number of free services for efficient trading.


