 Stay
Stay 
Trading Conditions
Products
Tools


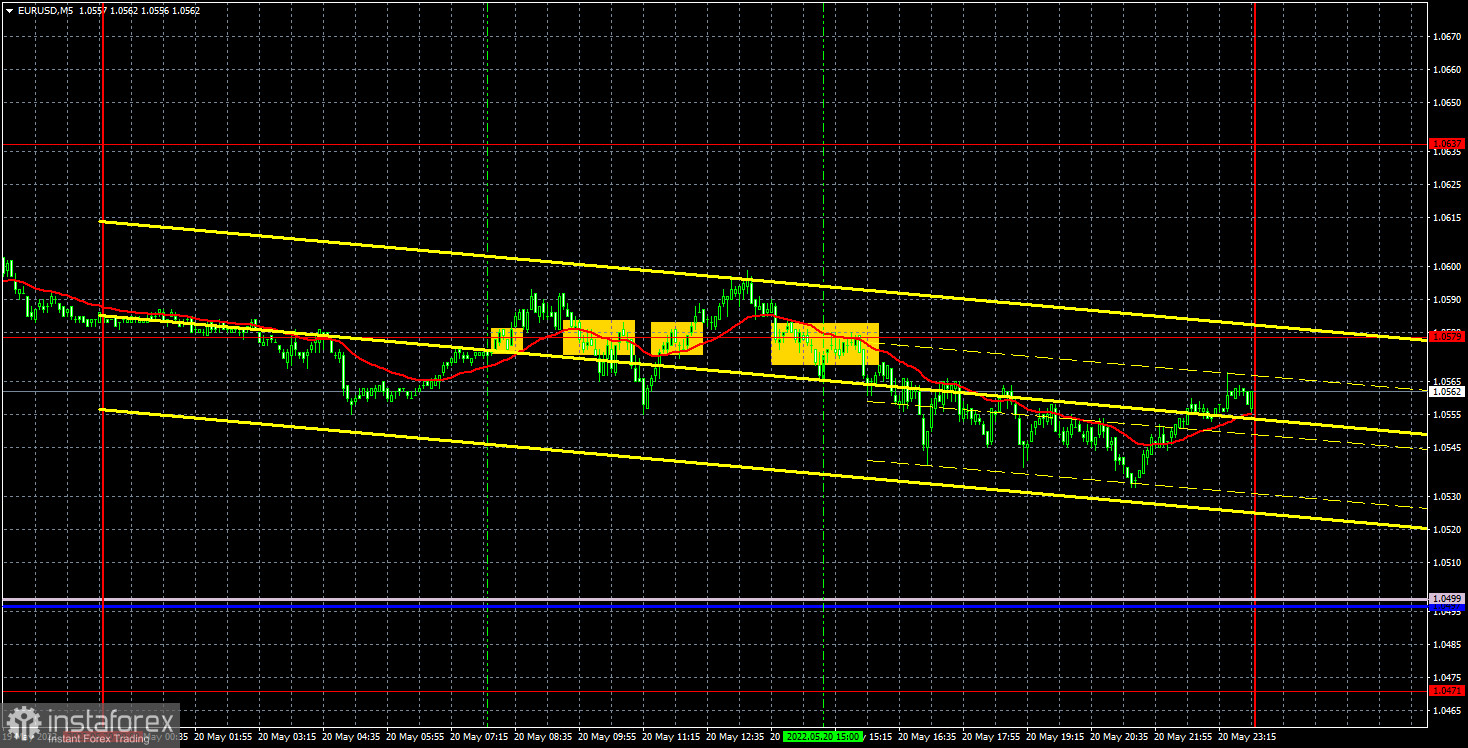
The EUR/USD pair tried to continue the upward correction against the global downtrend last Friday, but gave up around the 6th level. However, the pullback was very small, so the pair retains chances for the continuation of the upward movement in the new week. As we said earlier, at the moment the main support factor for the euro currency is technical. The only question is how much is enough? The last local high on the higher timeframes is located near the level of 1.0637. And at the moment, the price has not been able to reach it. That is, the downward trend continues. In this regard, the new week will be very interesting, as we will be able to get answers to many questions. For example, isn't the current growth of the euro just an "acceleration" before a new strong decline? Moreover, there will be few important macroeconomic statistics, therefore, the market will be able to show its true mood, without the influence of the foundation.
Trading signals on Friday were very bad. The pair has been trading around the level of 1.0579 throughout the European session, regularly breaking it. All signals of the day were formed around this level. Recall that such a picture clearly indicates a flat. And in the European session, the movement really looked flat. Therefore, it was possible to work out only the first two signals, which, of course, turned out to be false. The first buy signal could not provoke an upward movement even by 15 points, which would be enough to place a Stop Loss order at breakeven, the second sell signal is the same. As a result, traders could receive a loss on both transactions. Unfortunately, this happens in the market too. All subsequent trading signals should have been ignored, as the first two turned out to be false.
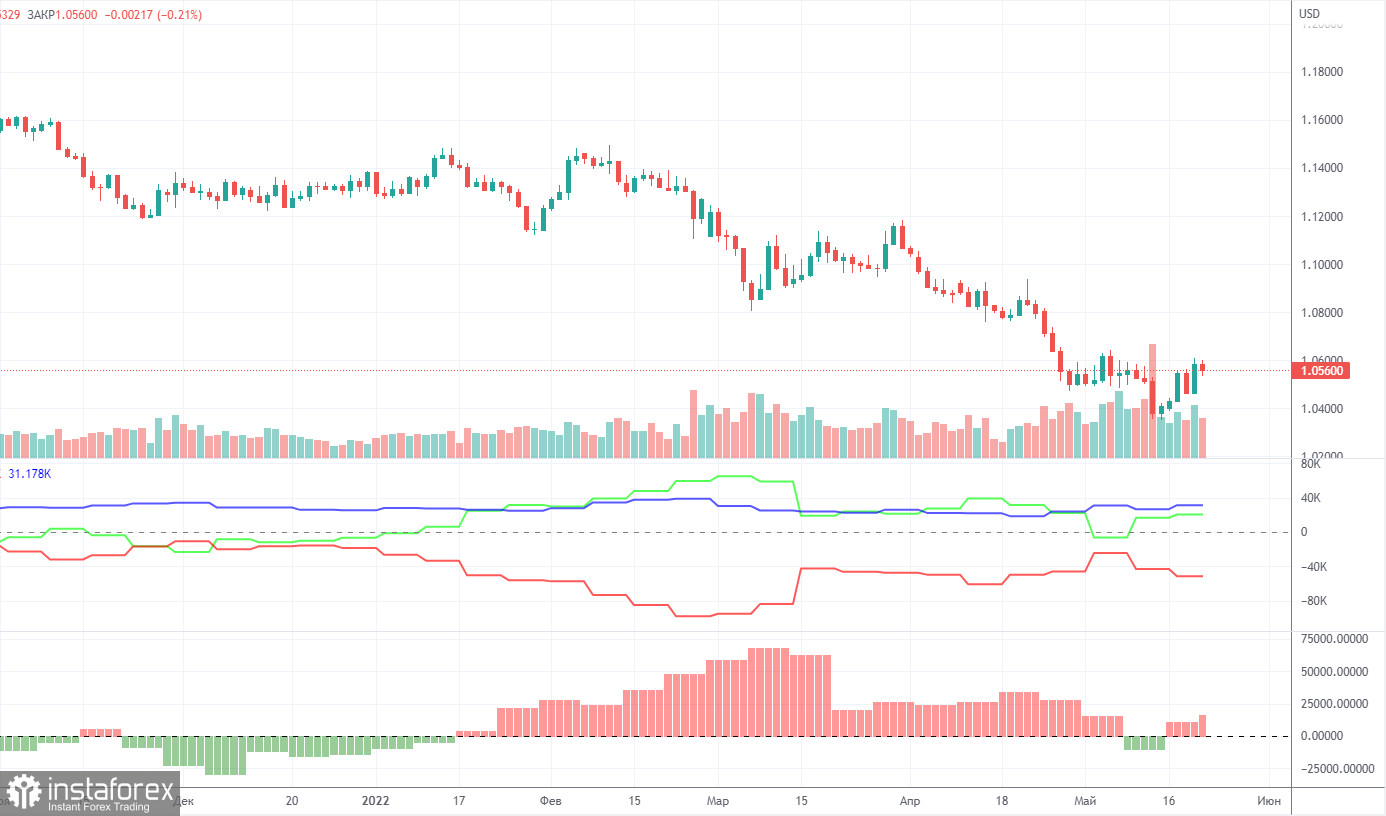
The latest Commitment of Traders (COT) reports on the euro caused and continue to raise more and more questions. The COT report showed the bearish mood of major players only once in the past few months, but in the last two weeks, the bullish mood is intensifying again. That is, a paradoxical situation remains, in which the euro currency has been falling for a long time, but professional players are buying up the euro, and not selling it. During the reporting week, the number of long positions increased by 2,500, while the number of shorts in the non-commercial group decreased by 1,200. Thus, the net position grew by 3,700 contracts per week. The number of longs exceeds the number of shorts for non-commercial traders by 20,000. From our point of view, this happens because the demand for the US dollar is much higher than the demand for the euro. Even if someone suggested that the whole point is the weakening of the bullish mood in recent months (the second indicator is the histogram), then this is hardly the case. The euro simply refuses to grow, despite any actions of major players. The chart above clearly shows that the euro fell both when the net position grew (increasing bullish sentiment) and when the net position decreased (weakened bullish sentiment). Thus, it is still impossible to draw a correlation between COT reports and what is happening in the market. It makes no sense to build forecasts on such data, all the more.
Overview of the EUR/USD pair. May 23. Euro hopes for a positive fundamental background. Otherwise there is little chance.
Overview of the GBP/USD pair. May 23. Indices of business activity and US GDP in the second assessment. The pound will seek further support.
Forecast and trading signals for GBP/USD on May 23. Detailed analysis of the movement of the pair and trading transactions.
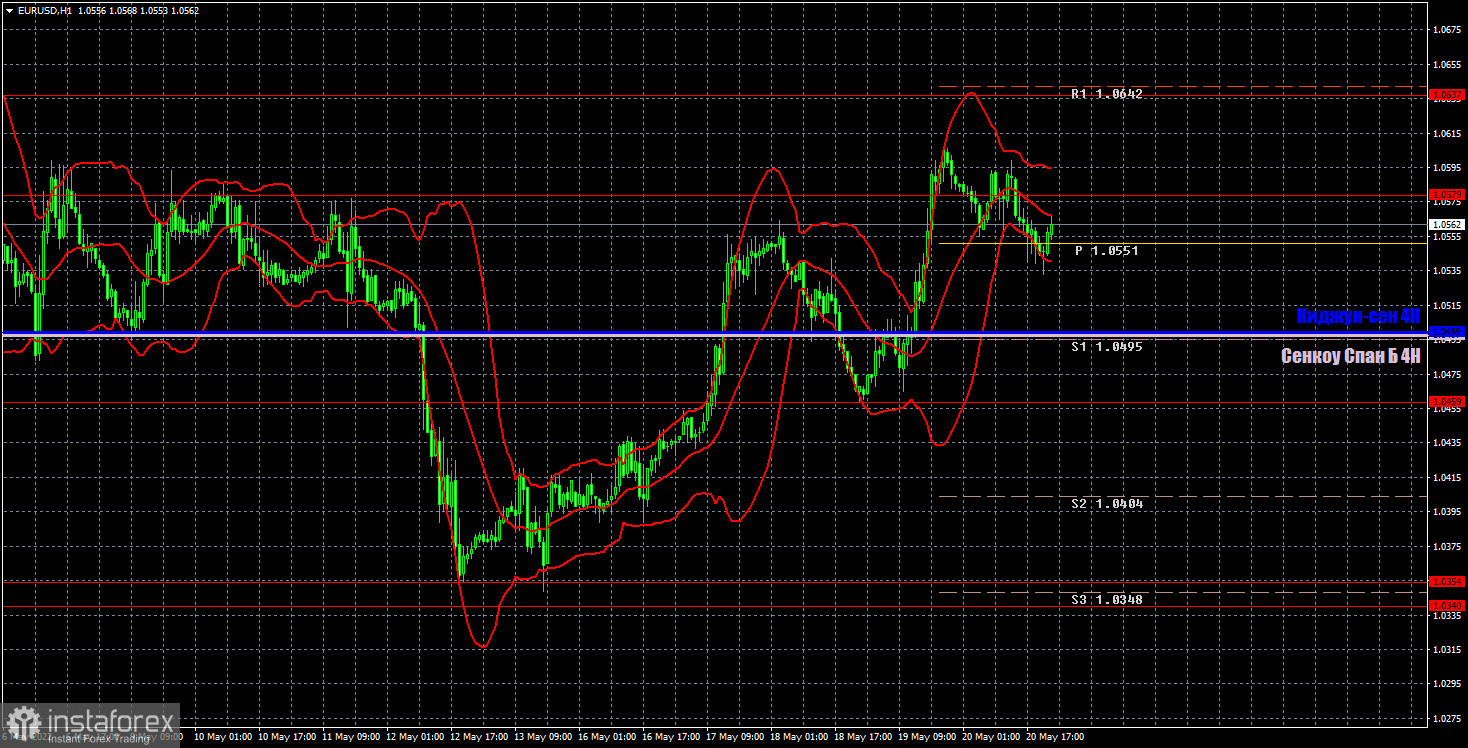
The pair continues to rise on the hourly timeframe, but, from our point of view, it is now very unstable. Do remember that fundamental, geopolitical and macroeconomic factors are now supporting the dollar more than the euro. On Monday, we highlight the following levels for trading - 1.0340-1.0354, 1.0459, 1.0579, 1.0637, 1.0729, as well as Senkou Span B (1.0497) and Kijun-sen (1 .0499). Ichimoku indicator lines can move during the day, which should be taken into account when determining trading signals. There are also secondary support and resistance levels, but no signals are formed near them. Signals can be "rebounds" and "breakthroughs" extreme levels and lines. Do not forget about placing a Stop Loss order at breakeven if the price has gone in the right direction for 15 points. This will protect you against possible losses if the signal turns out to be false. No important events or reports are scheduled for May 23 in the European Union and the United States. Thus, there will be nothing for traders to react to today. We believe that the market is now gradually calming down after very volatile recent weeks, so traders may not be that active tomorrow.
Support and Resistance Levels are the levels that serve as targets when buying or selling the pair. You can place Take Profit near these levels.
Kijun-sen and Senkou Span B lines are lines of the Ichimoku indicator transferred to the hourly timeframe from the 4-hour one.
Support and resistance areas are areas from which the price has repeatedly rebounded off.
Yellow lines are trend lines, trend channels and any other technical patterns.
Indicator 1 on the COT charts is the size of the net position of each category of traders.
Indicator 2 on the COT charts is the size of the net position for the non-commercial group.
InstaForex analytical reviews will make you fully aware of market trends! Being an InstaForex client, you are provided with a large number of free services for efficient trading.

