 Stay
Stay 
Trading Conditions
Products
Tools


The EUR/USD pair continued its upward correction on Monday against the global downward trend. This movement looks like an independent trend on small timeframes. No important macroeconomic statistics were released on Monday, but quite unexpectedly, European Central Bank President Christine Lagarde made a speech, saying that the central bank could raise the deposit rate to zero by the end of September. Thus, the market formally received the grounds for buying the euro. "Formally" - because the rhetoric of the ECB is still very weak, much weaker than the rhetoric and intentions of the Federal Reserve. That is, by the end of the third quarter, the ECB, at best, will bring the deposit rate to 0% (now -0.5%) and this is called tightening monetary policy?! That is, while the Fed rate will be at least 2%, in Europe it will be 0%. From our point of view, there were no reasons to buy the euro here, however, as we have already said in previous articles, now the market is clearly tuned in to a technical correction, so the euro is growing even without special reasons and grounds.
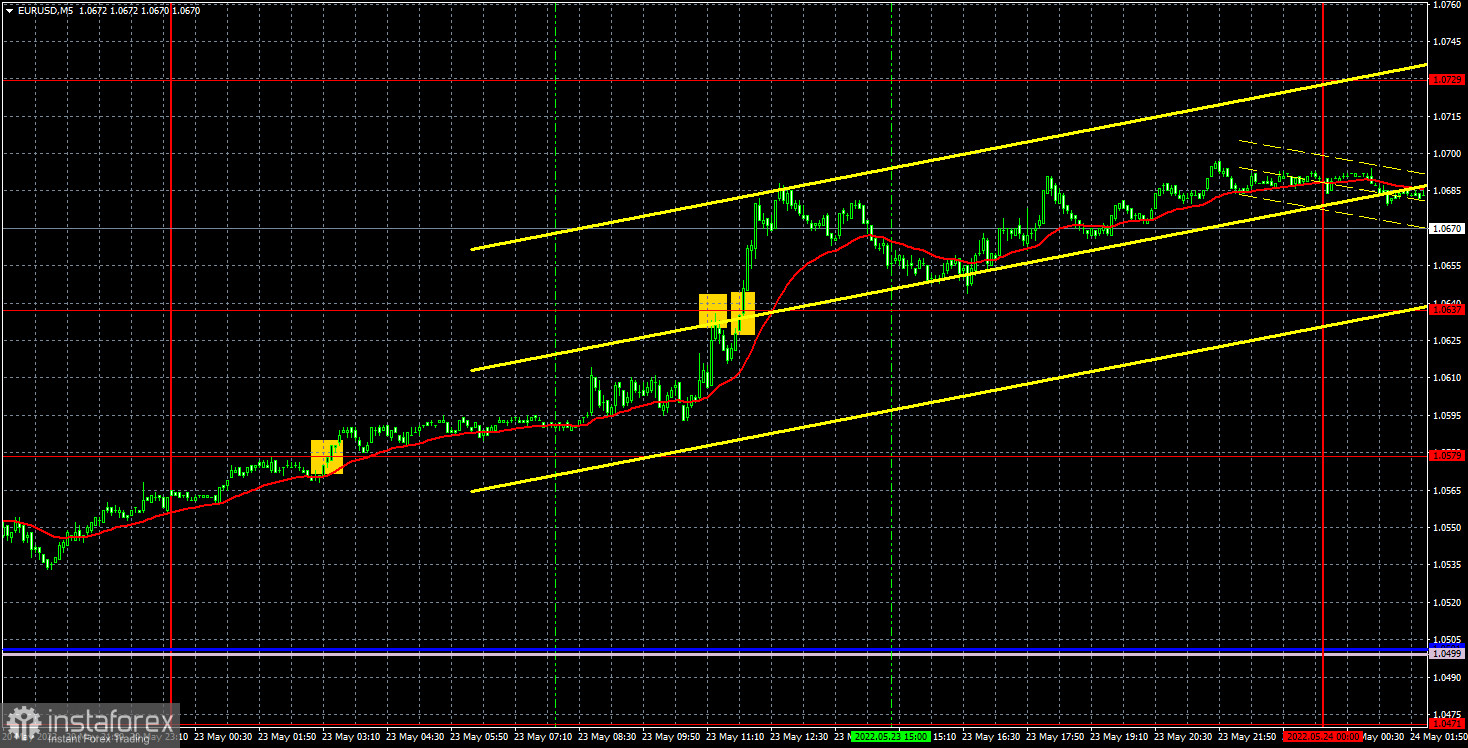
There were several trading signals on Monday. The first one for long positions was formed at night. We noted it because at the time when the European trading session opened, the price moved away by only a few points from the point where a signal could form. Accordingly, this signal could be worked out. The first round of the upward movement near the extreme level 1.0637 has ended, from which the pair rebounded. Unfortunately, this was a false sell signal. Long positions should be closed and shorts opened. But the pair failed to continue falling and in half an hour it overcame the level of 1.0637. Thus, traders had to re-open longs, which had to be closed manually in the evening, since the price failed to reach the next target level. As a result, we have two profitable trades and one loss. Total - 40 points of profit.
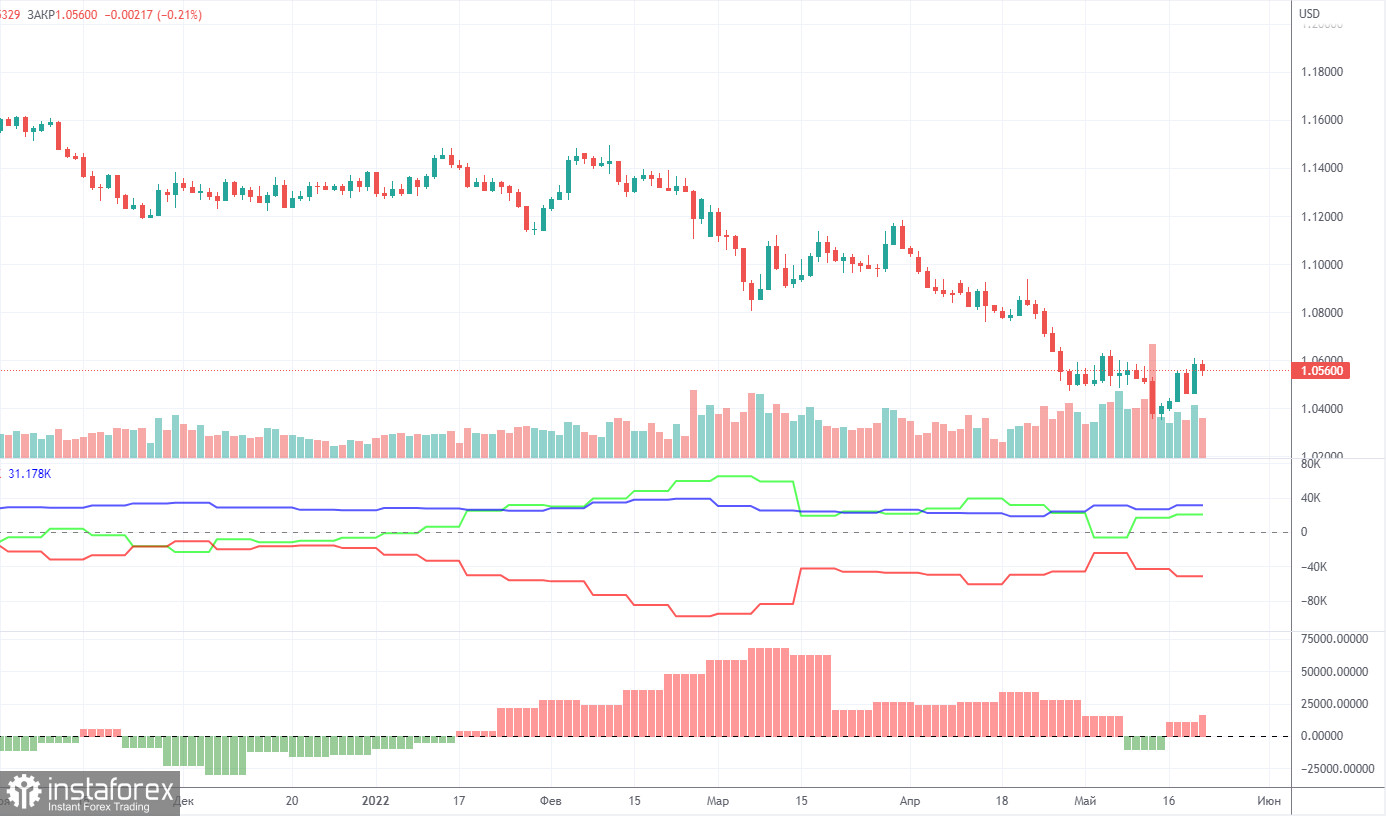
The latest Commitment of Traders (COT) reports on the euro caused and continue to raise more and more questions. The COT report showed the bearish mood of major players only once in the past few months, but in the last two weeks, the bullish mood is intensifying again. That is, a paradoxical situation remains, in which the euro currency has been falling for a long time, but professional players are buying up the euro, and not selling it. During the reporting week, the number of long positions increased by 2,500, while the number of shorts in the non-commercial group decreased by 1,200. Thus, the net position grew by 3,700 contracts per week. The number of longs exceeds the number of shorts for non-commercial traders by 20,000. From our point of view, this happens because the demand for the US dollar is much higher than the demand for the euro. Even if someone suggested that the whole point is the weakening of the bullish mood in recent months (the second indicator is the histogram), then this is hardly the case. The euro simply refuses to grow, despite any actions of major players. The chart above clearly shows that the euro fell both when the net position grew (increasing bullish sentiment) and when the net position decreased (weakened bullish sentiment). Thus, it is still impossible to draw a correlation between COT reports and what is happening in the market. It makes no sense to build forecasts on such data, all the more.
Overview of the EUR/USD pair. May 24. The euro started the week cheerfully, but will traders find grounds for further longs?
Overview of the GBP/USD pair. May 24. "Northern Ireland Protocol": the United States intervenes in the matter.
Forecast and trading signals for GBP/USD on May 24. Detailed analysis of the movement of the pair and trading transactions.
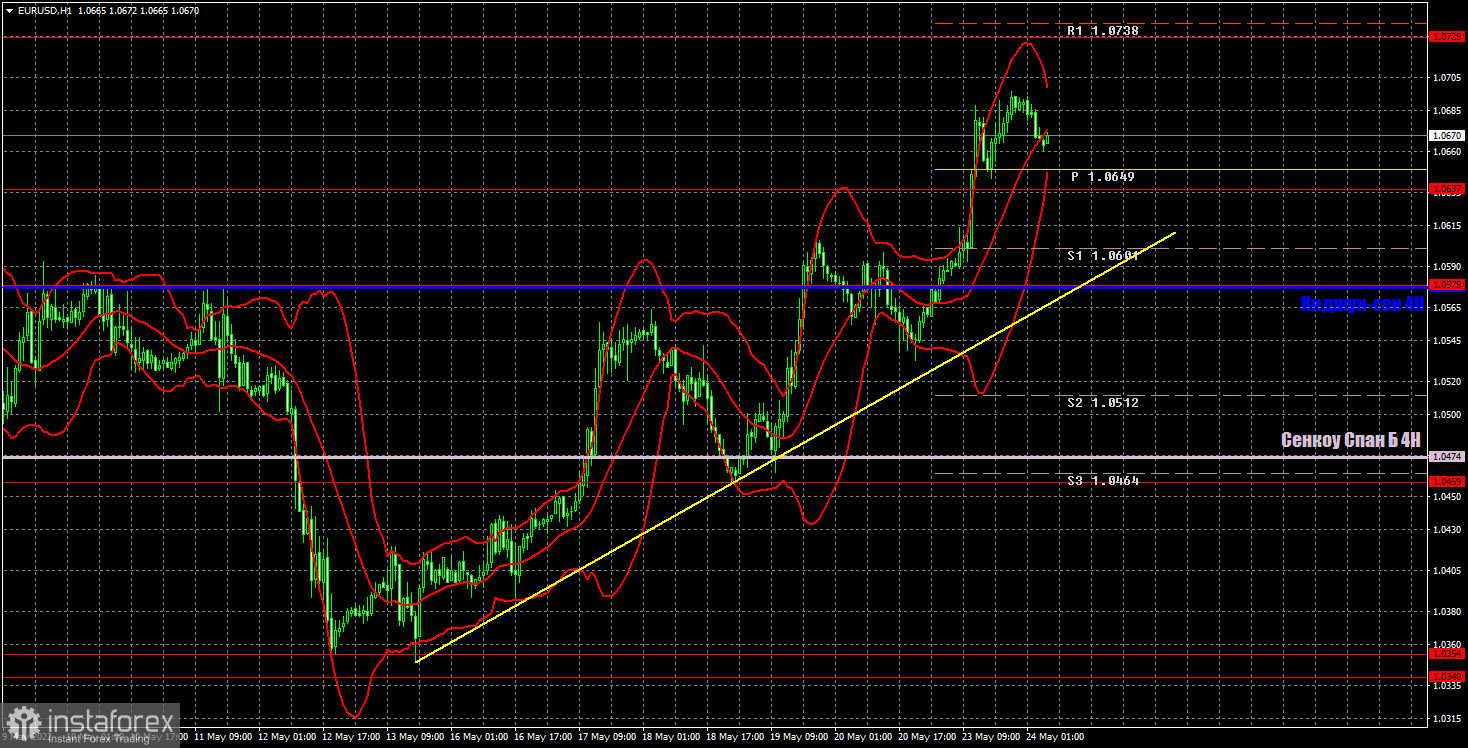
It is clearly seen that the pair continues a fairly strong upward movement on the hourly timeframe and an ascending trend line has been formed. The pair is also above the lines of the Ichimoku indicator, so there is an upward trend in the short term. The euro's main friend now is the technical factor. Today we allocate the following levels for trading - 1.0459, 1.0579, 1.0637, 1.0729, 1.0761, as well as the Senkou Span B (1.0474) and Kijun-sen (1.0578) lines. Ichimoku indicator lines can move during the day, which should be taken into account when determining trading signals. There are also secondary support and resistance levels, but no signals are formed near them. Signals can be "rebounds" and "breakthrough" extreme levels and lines. Do not forget about placing a Stop Loss order at breakeven if the price has gone in the right direction for 15 points. This will protect you against possible losses if the signal turns out to be false. The European Union is set to publish indexes of business activity in the services and manufacturing sectors. Similar reports will also be released in the United States. However, the most interesting events will be the evening speeches of Fed Chairman Jerome Powell and ECB President Christine Lagarde. Moreover, Lagarde nevertheless began to toughen her rhetoric.
Support and Resistance Levels are the levels that serve as targets when buying or selling the pair. You can place Take Profit near these levels.
Kijun-sen and Senkou Span B lines are lines of the Ichimoku indicator transferred to the hourly timeframe from the 4-hour one.
Support and resistance areas are areas from which the price has repeatedly rebounded off.
Yellow lines are trend lines, trend channels and any other technical patterns.
Indicator 1 on the COT charts is the size of the net position of each category of traders.
Indicator 2 on the COT charts is the size of the net position for the non-commercial group.
InstaForex analytical reviews will make you fully aware of market trends! Being an InstaForex client, you are provided with a large number of free services for efficient trading.


