 Stay
Stay 
Trading Conditions
Products
Tools


LTC/USD is trading in the red on the H4 chart but the bias remains bullish. It could extend its growth anytime. After its last rally, a minor retreat could be natural. It's located at 99.66 at the time of writing.
The altcoin increased by 8.02% from Monday's low of 94.78 to 102.38 today's high. Bitcoin continues to move somehow sideways in the short term, that's why LTC/USD could move sideways in the short term as well.
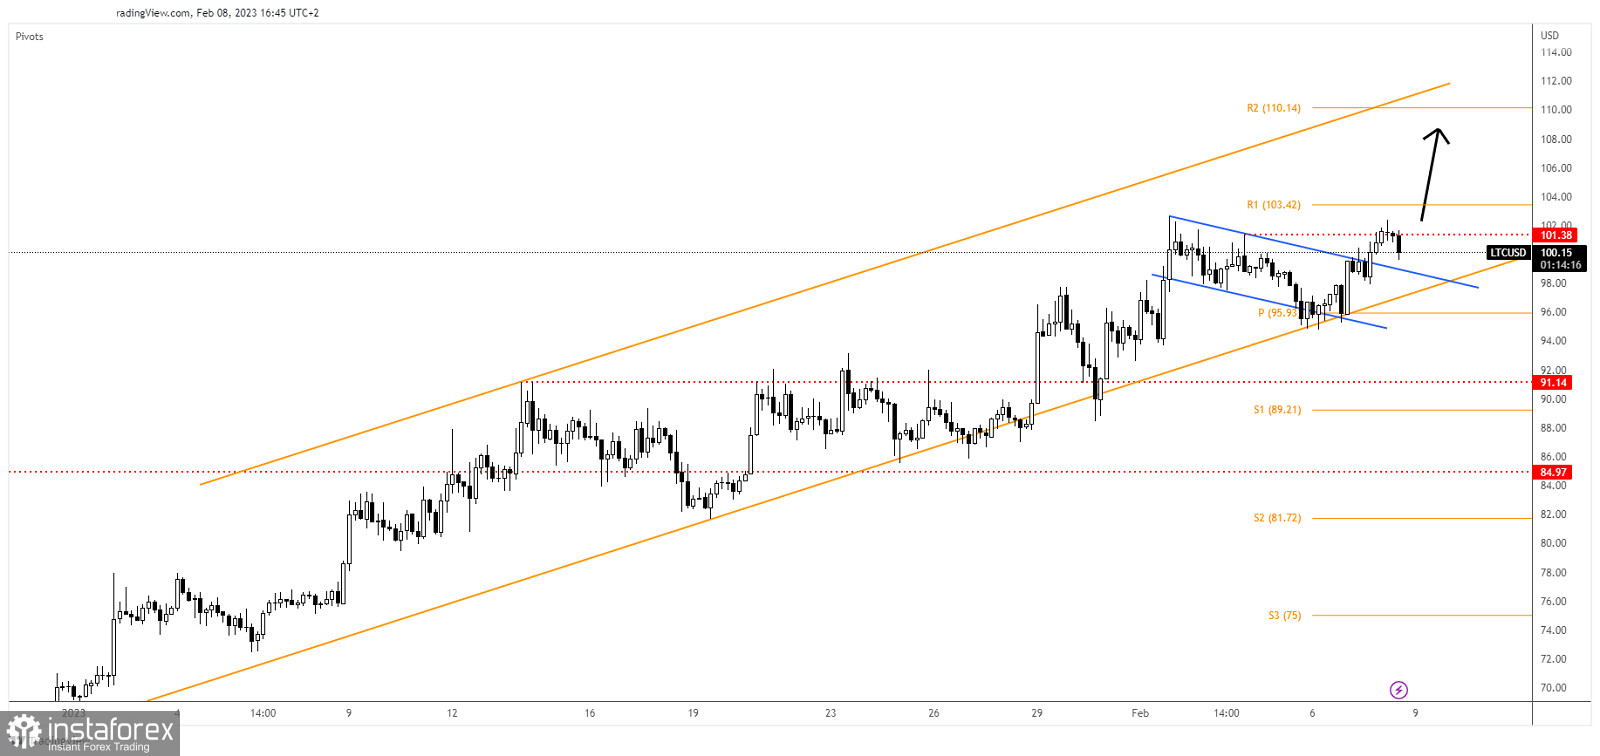
LTC/USD found support on the uptrend line and now it has escaped from the flag pattern. You knew from my previous analysis that the price action developed a minor bullish pattern inside of the up channel. As you can see on the H4 chart, the rally was halted by 101.38 static resistance.
The token could come back to test and retest the near-term support levels before resuming its growth.
Staying above the uptrend line and making a valid breakout above 101.38 activates further growth and brings a new long signal.
InstaForex analytical reviews will make you fully aware of market trends! Being an InstaForex client, you are provided with a large number of free services for efficient trading.

