 Stay
Stay 
Trading Conditions
Products
Tools


The EUR/USD currency pair recovered on Thursday against the movement shown the day before. If on Tuesday the pair was falling quite heavily and at the end of the day managed to gain a foothold below the moving average line, then on Wednesday it was already growing, although not as much as it was falling. However, although all current movements cannot be called weakly volatile (the illustration below clearly shows that volatility is high now), they are still ambiguous. We have already said in previous articles that traders now need to make an important decision for themselves: either a technical correction continues, or a 2-year downward trend resumes with targets below the 20-year lows of the pair. Note that the technical correction is supported only by the technical factor, no matter how banal it may sound. But the new growth of the US currency supports a fairly large number of factors that we have already listed more than once. Unfortunately, there have been frankly few important news and events in the world in recent days or even weeks.
The markets are now discussing widespread, trending topics. Such as inflation in any country of the world to choose from, monetary policies of the ECB or the Fed, the geopolitical conflict in Ukraine, the accession of Finland and Sweden to NATO, and the sixth package of sanctions against Russia by the European Union. New data is constantly being received on any of these topics, but they practically do not cause any market reaction. In fairness, it should be noted that in the first two months of the conflict between Ukraine and Russia, not every piece of news was worked out logically and reasonably. At that time, the dollar was growing almost recoilless, so, most likely, traders simply bought it as a "reserve" currency. Thus, now, if we assume that the factor of geopolitics no longer affects the euro and the pound so much, then these currencies can continue to move north, but, unfortunately, there are more chances now for a resumption of the downward trend, given the location of the price below the moving average.
Macroeconomic statistics: what is it now?
All the news of recent days has already been covered several times. Let's take yesterday, what was interesting on Thursday? A single report from ADP in the USA on the change in the number of employees in the private sector of the economy. It turned out to be much weaker than forecasts, much weaker than the previous value, but what was the market reaction? The dollar began to fall at night and at the time of publication of this report has already lost about 50 points. After the ADP report became known to traders, nothing changed. One could assume that traders had played a weak ADP report in advance, but how could they know its value before the opening of the American trading session? Therefore, we believe that the version about the baselessness of the dollar's growth on Tuesday is more logical when this currency rose by 80 points on a completely banal ISM report on business activity in the manufacturing sector. This report is more important than the usual business activity index, but its value differed only very slightly from the forecast and the value of April, so the growth of the US currency by 80 points can hardly be considered a logical reaction of the market. Thus, we believe that on Thursday, the market seemed to pay a debt to the European currency, which had suffered without fault the day before. In general, now the price is too close to the moving average to make an unambiguous conclusion about the formation of a new downward trend. And at the same time, the price is too close to its 20-year lows to make an unambiguous conclusion about the end of a long-term downward trend. The situation is too ambiguous at this time, and the price can overcome the moving again at any time.
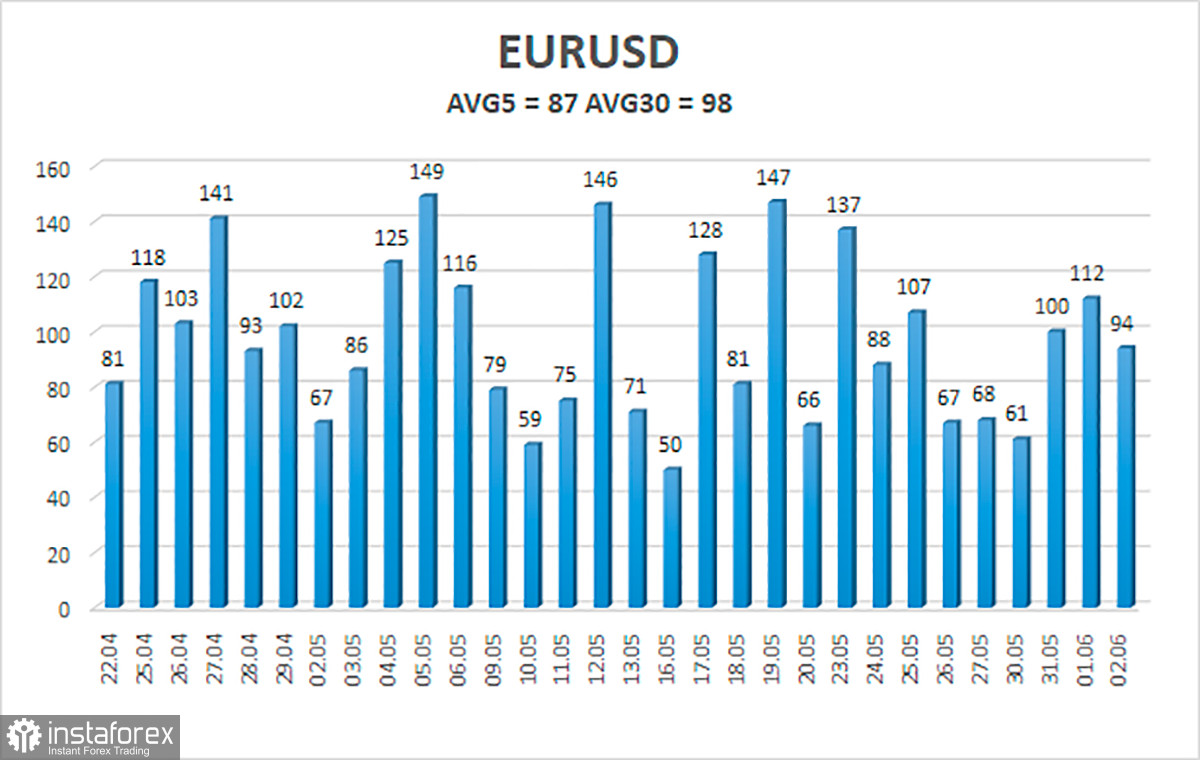
The average volatility of the euro/dollar currency pair over the last 5 trading days as of June 3 is 87 points and is characterized as "average". Thus, we expect the pair to move today between the levels of 1.0650 and 1.0824. A reversal of the Heiken Ashi indicator back down will signal a possible new round of downward movement.
Nearest support levels:
S1 – 1.0620
S2 – 1.0498
S3 – 1.0376
Nearest resistance levels:
R1 – 1.0742
R2 – 1.0864
R3 – 1.0986
Trading recommendations:
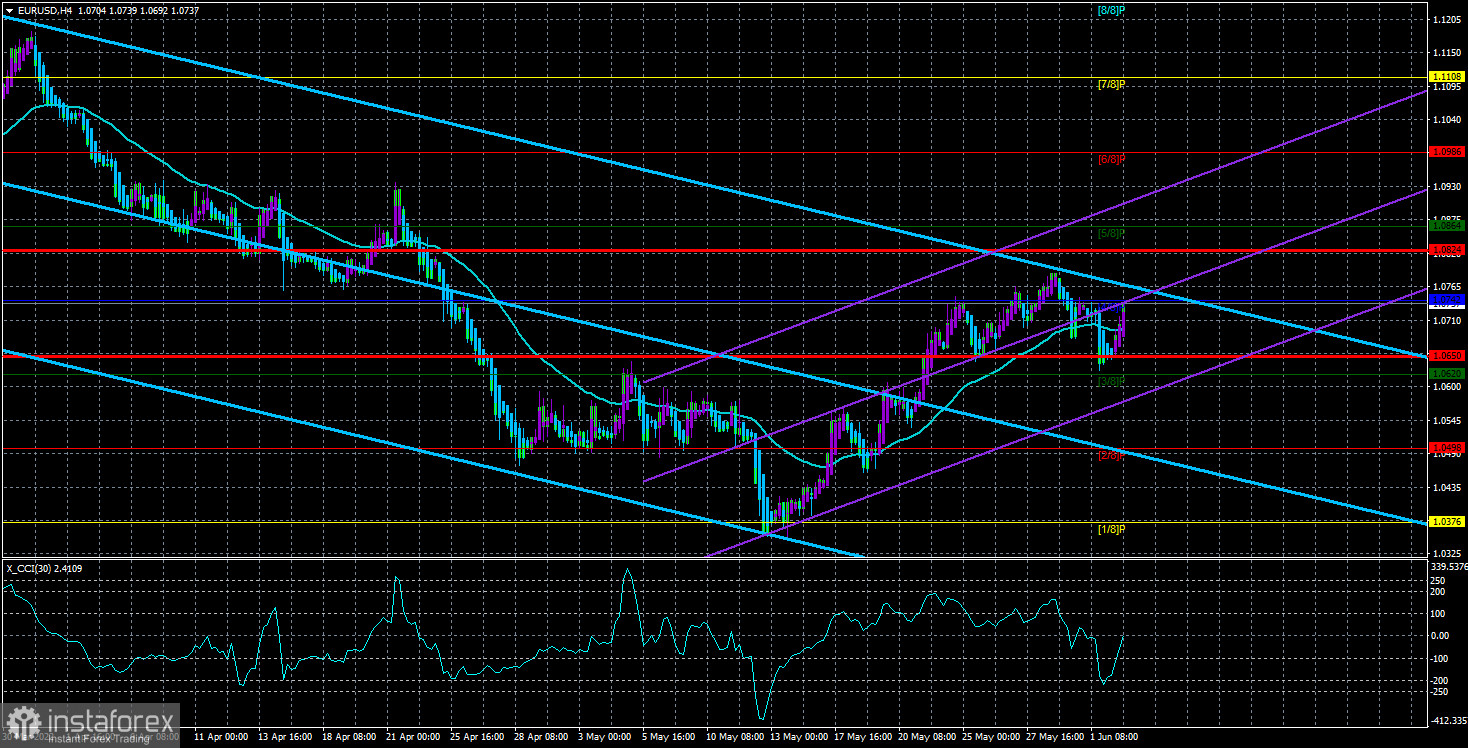
The EUR/USD pair continues to consolidate back above the moving average and may resume the formation of an upward trend. Thus, now you should stay in long positions with targets of 1.0824 and 1.0864 until the Heiken Ashi indicator turns down. Short positions should be opened with a target of 1.0620 if the price is fixed below the moving average line. At this time, there is a probability of the beginning of a "swing".
Explanations of the illustrations:
Linear regression channels - help determine the current trend. If both are directed in the same direction, then the trend is strong now.
Moving average line (settings 20.0, smoothed) - determines the short-term trend and the direction in which to trade now.
Murray levels - target levels for movements and corrections.
Volatility levels (red lines) - the likely price channel in which the pair will spend the next day, based on current volatility indicators.
CCI indicator - its entry into the oversold area (below -250) or into the overbought area (above +250) means that a trend reversal in the opposite direction is approaching.
InstaForex analytical reviews will make you fully aware of market trends! Being an InstaForex client, you are provided with a large number of free services for efficient trading.

