 Stay
Stay 
Trading Conditions
Products
Tools


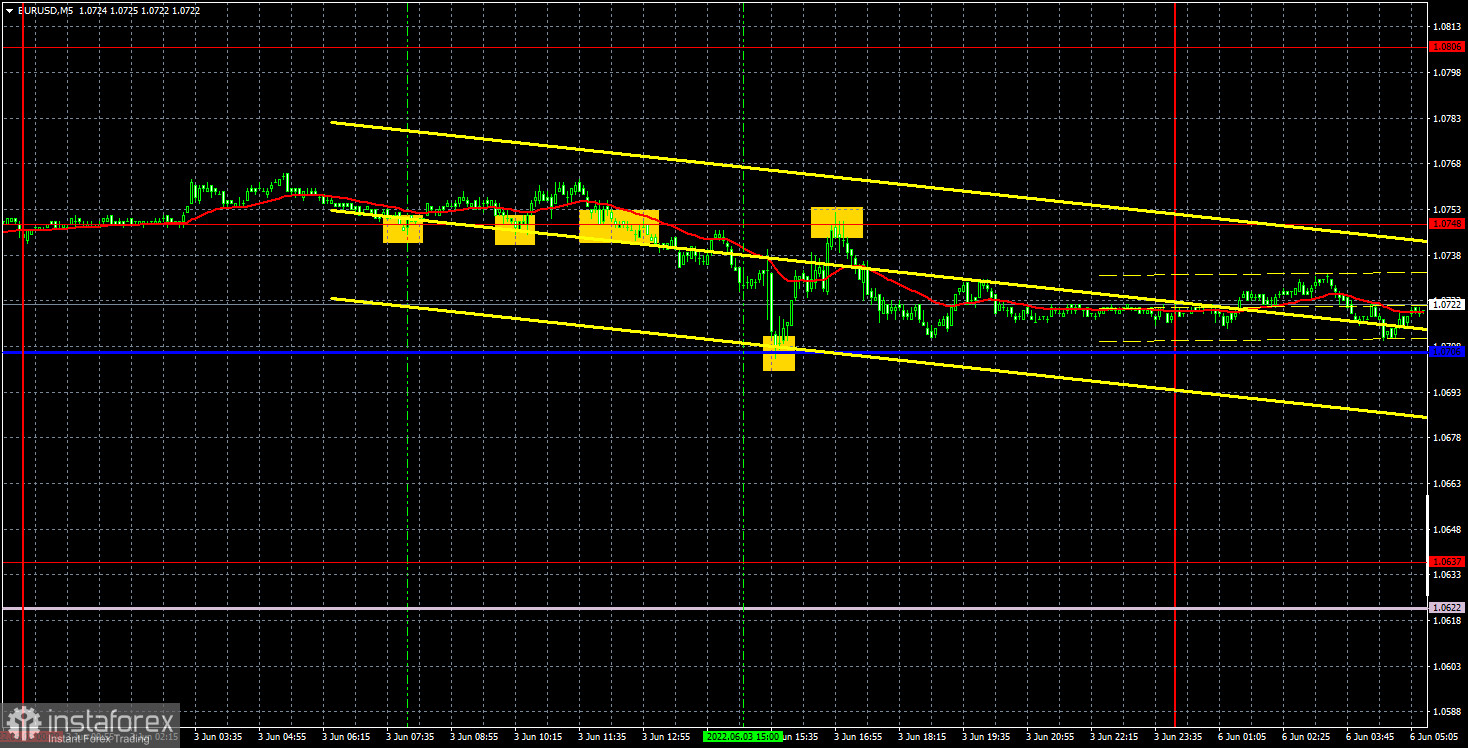
The EUR/USD pair made a new attempt to start a downward correction last Friday. Quotes began to decline even during the European trading session, having previously failed to overcome the local high. However, all the most interesting things were planned for the US trading session. Important statistics were published in America during this time period, which the market could not ignore. The NonFarm Payrolls report, which is considered one of the most important for currency traders, turned out to be significantly stronger than forecasts, so traders had the right to expect a sharp strengthening of the US currency. Moreover, most factors continue to be on its side. However, instead of a strong drop in the pair, we saw only a move down 30 points, and then a stronger increase, which ended with a new fall by 40 points down. Thus, we saw a "swing", and, from our point of view, such a reaction of the market was not logical. For example, the British pound showed a strong fall without any rollbacks up there.
But at the same time, strong trading signals were formed. But let's start from the very beginning of the trading day. Three trading signals were formed in the morning. The first two to buy, which duplicated each other and turned out to be false. One trading deal could be opened, which closed with a minimum loss. Then there was a sell signal near the level of 1.0748, after which the pair dropped to the Kijun-sen line, worked it out and formed a buy signal. It was possible to earn 23 points on a short position and immediately open a long position, which closed near the level of 1.0748, which the pair perfectly worked out again. Another 23 points of profit and a new short position, which brought about 20 more points of profit, and it had to be closed manually. Let's pay attention once again to the fact that both signals at the US session were ideal in terms of accuracy.
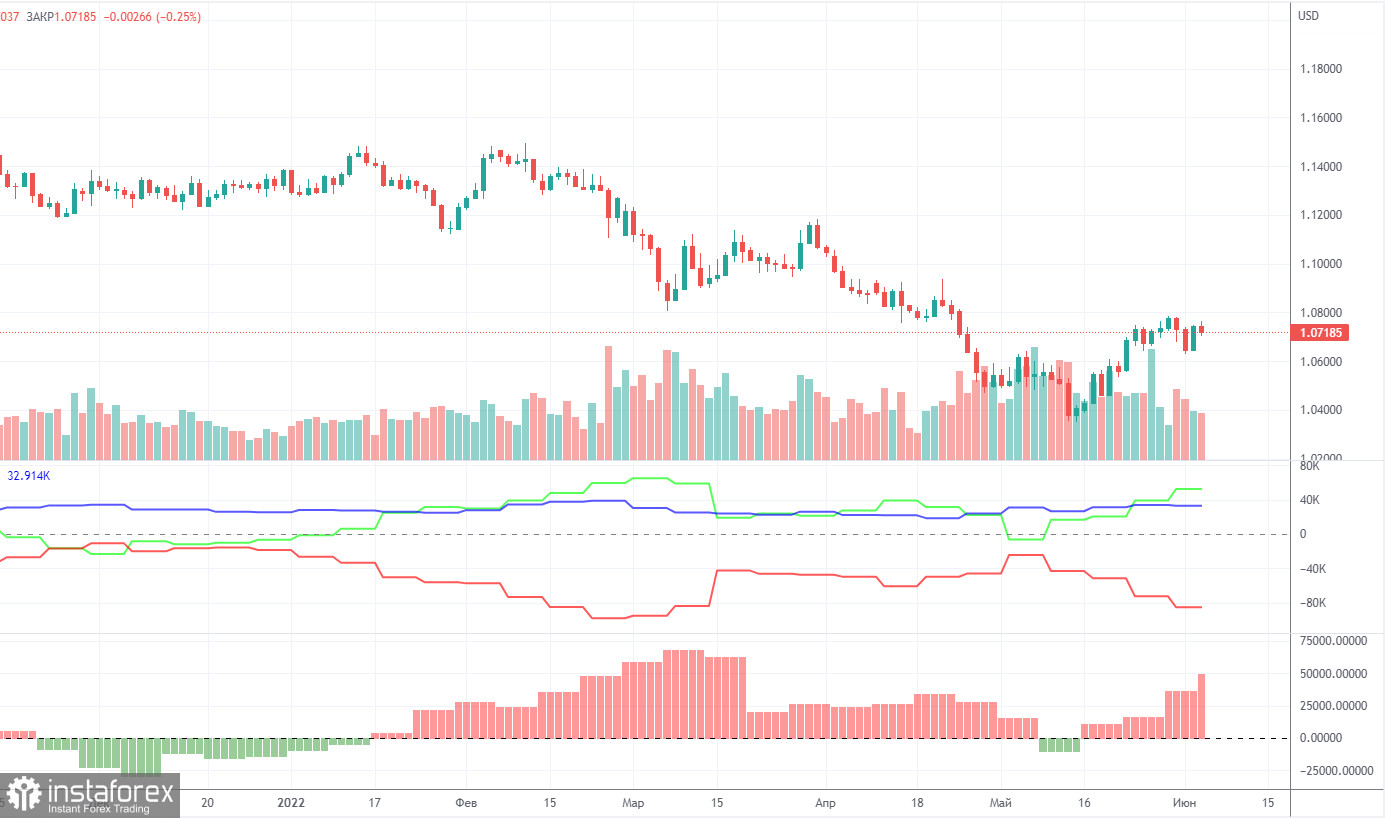
The latest Commitment of Traders (COT) reports on the euro raised a lot of questions. Recall that in the past few months, they showed a blatant bullish mood of professional players, but the euro fell all the time. Now the situation has begun to change, but not at the expense of the market players themselves, but due to the fact that the euro has begun to grow. That is, the mood of traders remains bullish (according to COT reports), and the euro began to grow due to the fact that it needs to be corrected from time to time. But at the same time, the bullish mood has persisted for quite some time, and the euro has barely managed to add 400 points in the last few weeks. During the reporting week, the number of long positions decreased by 500, and the number of shorts in the non-commercial group decreased by 13,800. Thus, the net position grew by 14,300 contracts per week. The number of longs exceeds the number of shorts for non-commercial traders by 50,000 already. From our point of view, this happens because the demand for the US dollar remains much higher than the demand for the euro. Now a certain "respite" has begun for the euro, but this does not mean that the global downward trend will not resume on Monday, and the data from COT reports will not continue to contradict the real state of things on the market. Therefore, we believe that it is still impossible to rely on such report data for forecasting.
Overview of the EUR/USD pair. June 6. ECB meeting: does it make sense to follow it at all?
Overview of the GBP/USD pair. June 6. Nonfarm knocked down the British pound.
Forecast and trading signals for GBP/USD on June 6. Detailed analysis of the movement of the pair and trading transactions.
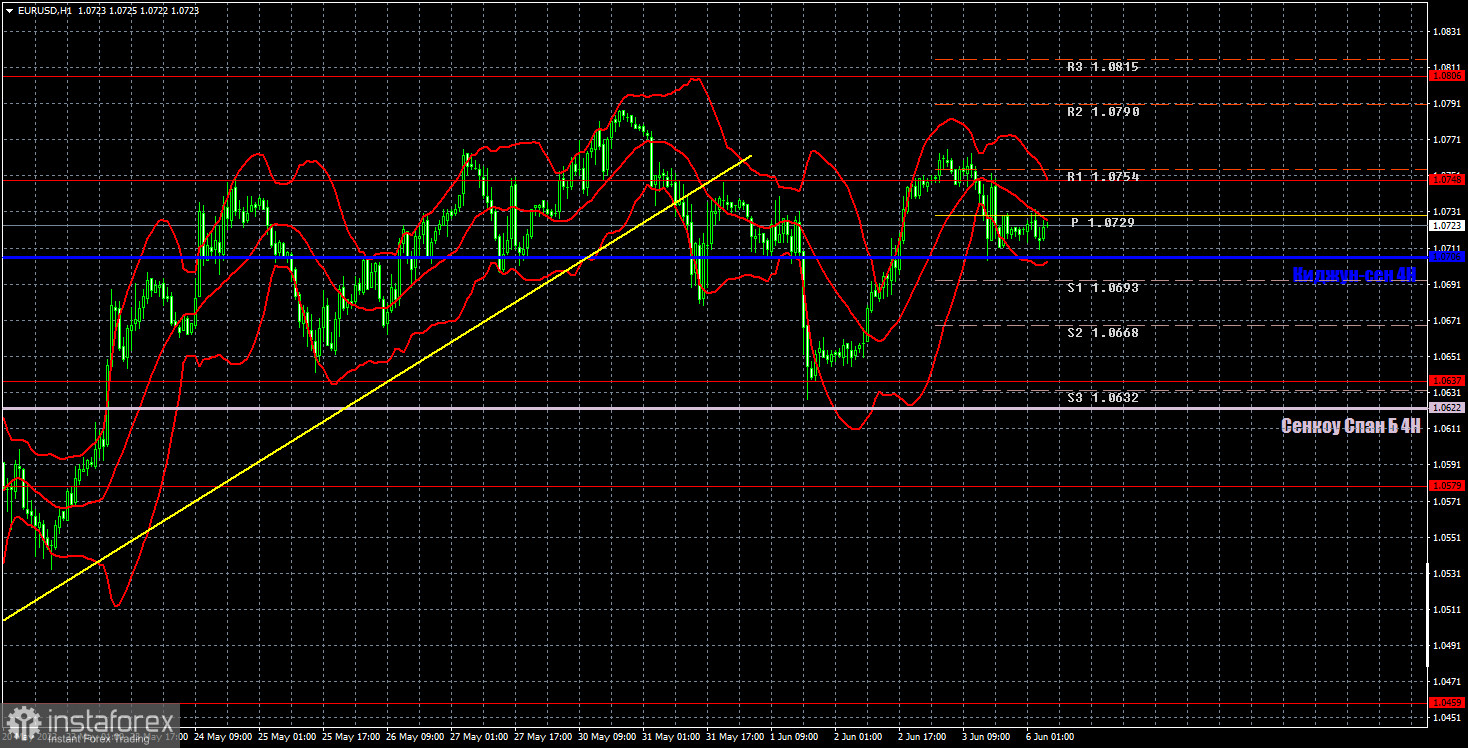
The pair is currently trying to restore the upward trend on the hourly timeframe. The price managed to initially consolidate above the critical line, and then to stay above it. Thus, if we close our eyes to the NonFarm Payrolls report, then today the euro has a chance of growth. But consolidating under the Kijun-sen line will lead to a new fall of the pair. Today we highlight the following levels for trading - 1.0459, 1.0579, 1.0637, 1.0748, 1.0806, as well as Senkou Span B (1.0622) and Kijun-sen (1.0706). Ichimoku indicator lines can move during the day, which should be taken into account when determining trading signals. There are also secondary support and resistance levels, but no signals are formed near them. Signals can be "rebounds" and "breakthrough" extreme levels and lines. Do not forget about placing a Stop Loss order at breakeven if the price has gone in the right direction for 15 points. This will protect you against possible losses if the signal turns out to be false. No important events are planned for June 6 in the European Union and the United States. Traders will have nothing to pay attention to during the day.
Support and Resistance Levels are the levels that serve as targets when buying or selling the pair. You can place Take Profit near these levels.
Kijun-sen and Senkou Span B lines are lines of the Ichimoku indicator transferred to the hourly timeframe from the 4-hour one.
Support and resistance areas are areas from which the price has repeatedly rebounded off.
Yellow lines are trend lines, trend channels and any other technical patterns.
Indicator 1 on the COT charts is the size of the net position of each category of traders.
Indicator 2 on the COT charts is the size of the net position for the non-commercial group.
InstaForex analytical reviews will make you fully aware of market trends! Being an InstaForex client, you are provided with a large number of free services for efficient trading.


