 Stay
Stay 
Trading Conditions
Products
Tools


The EUR/USD pair continued to fall on Monday. Neither the United States nor the European Union published a single important report and there were no significant events either. Thus, the market had nothing to react to during the day. However, this did not become a reason not to trade or correct the pair. A day earlier, we assumed that a correction would begin on Monday, since the movements on Thursday and Friday were already very strong. However, the euro even continued to fall on Monday, although on that day there were absolutely no grounds for this. Thus, the euro's worst dream is coming true - traders are again looking only towards the dollar, so the long-term downward trend will most likely resume, and the price may drop to 20-year lows in the coming days.
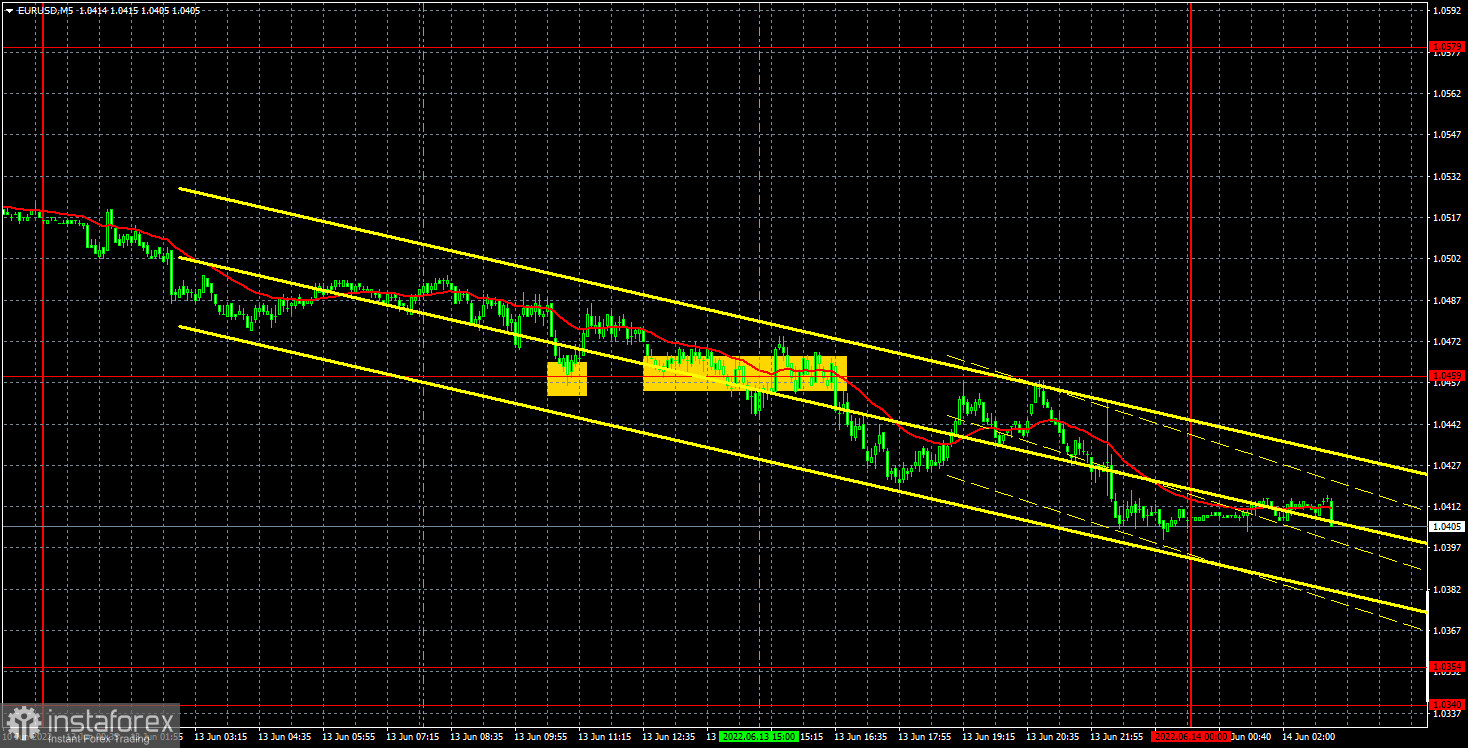
As for trading signals, despite the good trend movement, the quality of the signals left much to be desired. The first buy signal turned out to be accurate, but false. The price rebounded from the level of 1.0459, but managed to go up only 18 points, which was enough to set Stop Loss to breakeven, so the deal closed at zero. It is very difficult to call the next signal even a signal, because the pair "danced" around the level of 1.0459 for several hours, eventually breaking it. We would advise you to skip this signal, although in the end it turned out to be profitable. As a result, Monday could have ended either at zero or at a minimum profit.
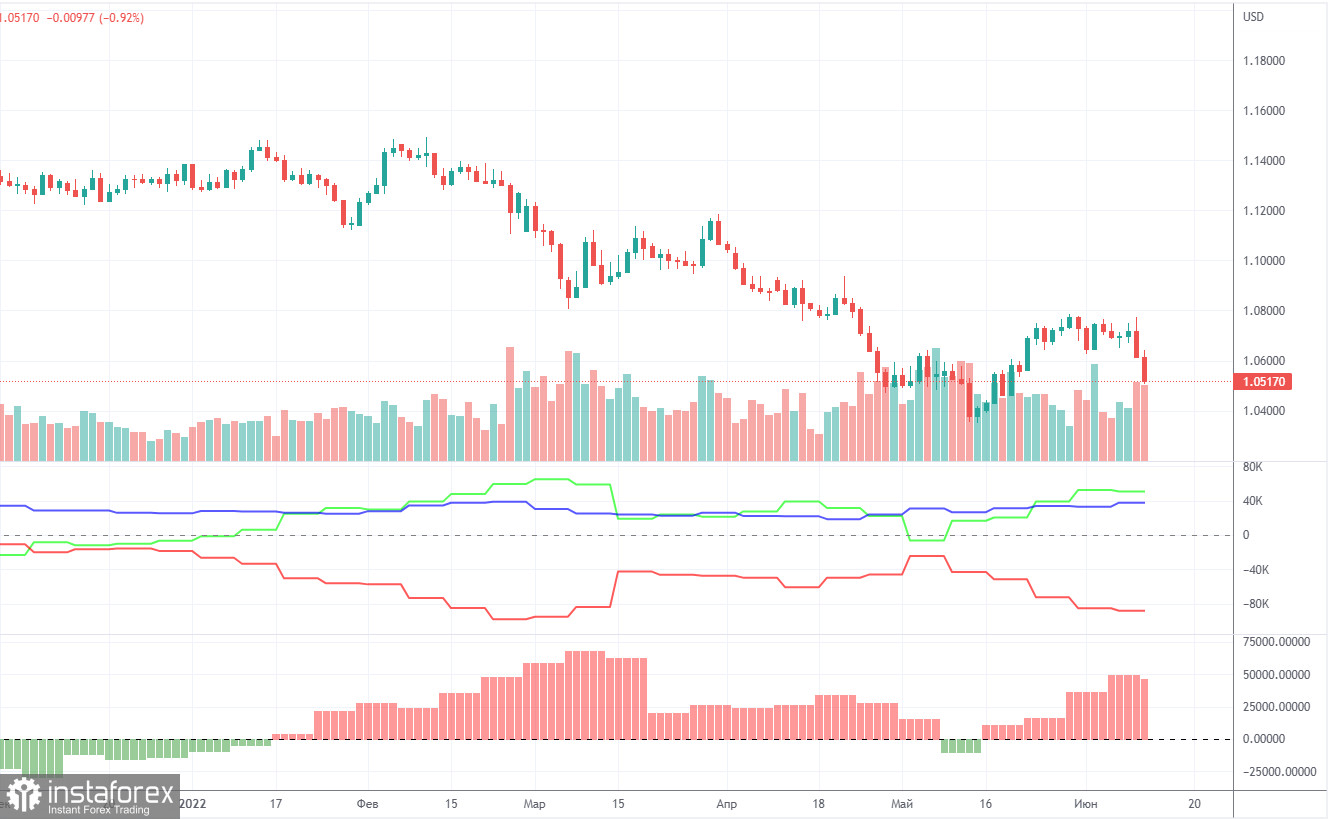
The latest Commitment of Traders (COT) reports on the euro raised a lot of questions. Recall that in the past few months, they showed a blatant bullish mood of professional players, but the euro fell all the time. At this time, the situation has not changed. The euro tried to show growth, but last week it collapsed. Therefore, we again have a situation in which the mood of the major players is bullish, but the euro is falling. The number of long positions decreased by 6,300 during the reporting week, and the number of shorts in the non-commercial group decreased by 4,500. Thus, the net position decreased by 1,800 contracts per week. The number of long positions exceeds the number of shorts for non-commercial traders by 50,000. The second indicator in the chart above perfectly shows that the net position has been positive for a long time, and the pair's movement chart in the same chart shows a downward movement. From our point of view, this happens because the demand for the US dollar remains much higher than the demand for the euro . The "respite" for the euro, which has been observed in recent weeks, did not last long, and the global downward trend remains in force. Therefore, we believe that the data of COT reports on the euro still cannot be relied upon when predicting the future movement of the euro/dollar pair.
Overview of the EUR/USD pair. June 14. The euro did not even think to stop in its fall.
Overview of the GBP/USD pair. June 14. The British economy began to shrink. The pound is falling into the abyss.
Forecast and trading signals for GBP/USD on June 14. Detailed analysis of the movement of the pair and trading transactions.
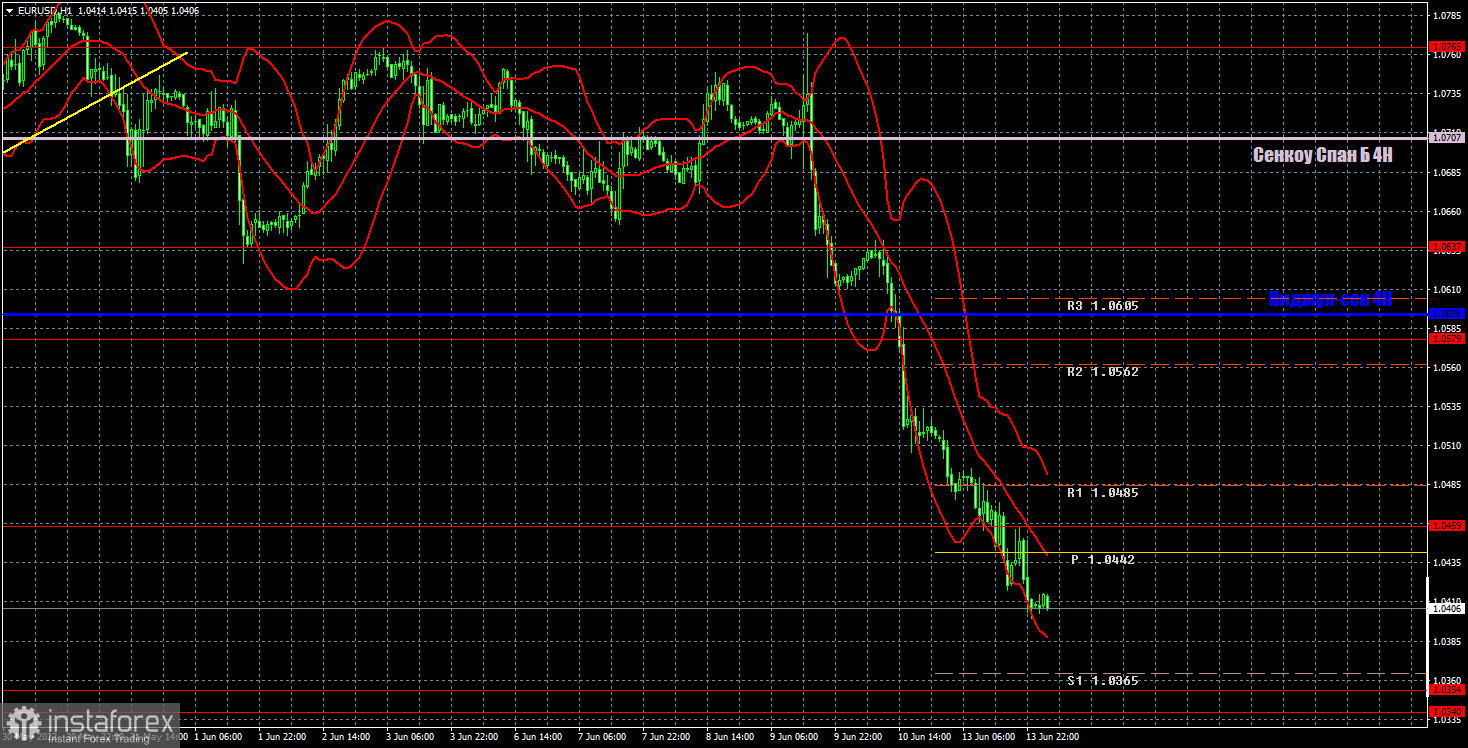
An almost landslide decline continues on the hourly timeframe. Maybe the downward movement on Monday was not the strongest, but if you sum it up with the movements on Friday and Thursday, it turns out to be very strong and without a single correction. Thus, the euro is now at least finding the strength to correct... And the results of the Federal Reserve meeting will be announced on Thursday... Today, we allocate the following levels for trading - 1.0340-1.0354, 1.0459, 1.0579, 1.0637, 1.0765, as well as the Senkou Span B (1.0707) and Kijun-sen (1.0595) lines. Ichimoku indicator lines can move during the day, which should be taken into account when determining trading signals. There are also secondary support and resistance levels, but no signals are formed near them. Signals can be "rebounds" and "breakthrough" extreme levels and lines. Do not forget about placing a Stop Loss order at breakeven if the price has gone in the right direction for 15 points. This will protect you against possible losses if the signal turns out to be false. No interesting reports or other important events are planned for June 14 in the EU and the US. Thus, traders will have nothing to react to during the day. We will again expect a correction, but the euro may continue to fall.
Support and Resistance Levels are the levels that serve as targets when buying or selling the pair. You can place Take Profit near these levels.
Kijun-sen and Senkou Span B lines are lines of the Ichimoku indicator transferred to the hourly timeframe from the 4-hour one.
Support and resistance areas are areas from which the price has repeatedly rebounded off.
Yellow lines are trend lines, trend channels and any other technical patterns.
Indicator 1 on the COT charts is the size of the net position of each category of traders.
Indicator 2 on the COT charts is the size of the net position for the non-commercial group.
InstaForex analytical reviews will make you fully aware of market trends! Being an InstaForex client, you are provided with a large number of free services for efficient trading.

