 Stay
Stay 
Trading Conditions
Products
Tools


The GBP/USD currency pair showed a volatility equal to 360 points on Thursday... Is there anything else to say about how the pair moved yesterday? This kind of volatility happens a few times a year, but it shouldn't come as a surprise as both central banks have been hawkish and have raised rates. How else was the market supposed to react to these events? Interestingly, at the end of the day, the pound showed the strongest growth. That is, both banks raised rates, but it was the pound that rose. From our point of view, this suggests that the Federal Reserve meeting was won back by the market in advance, when the British currency lost about 600 points (end of last week - beginning of the current one). Therefore, although we do not believe that the market's reaction was completely logical, this scenario was still expected. The most interesting thing is that now the pound may well resume the global downward trend, just like the euro. The results of the meetings of central banks have been worked out, but what kind of support does European currencies have? The Fed rate is still higher than the European Central Bank or the Bank of England rate. Thus, we will not be at all surprised if the British currency falls, despite the hawkish attitude of the British central bank.
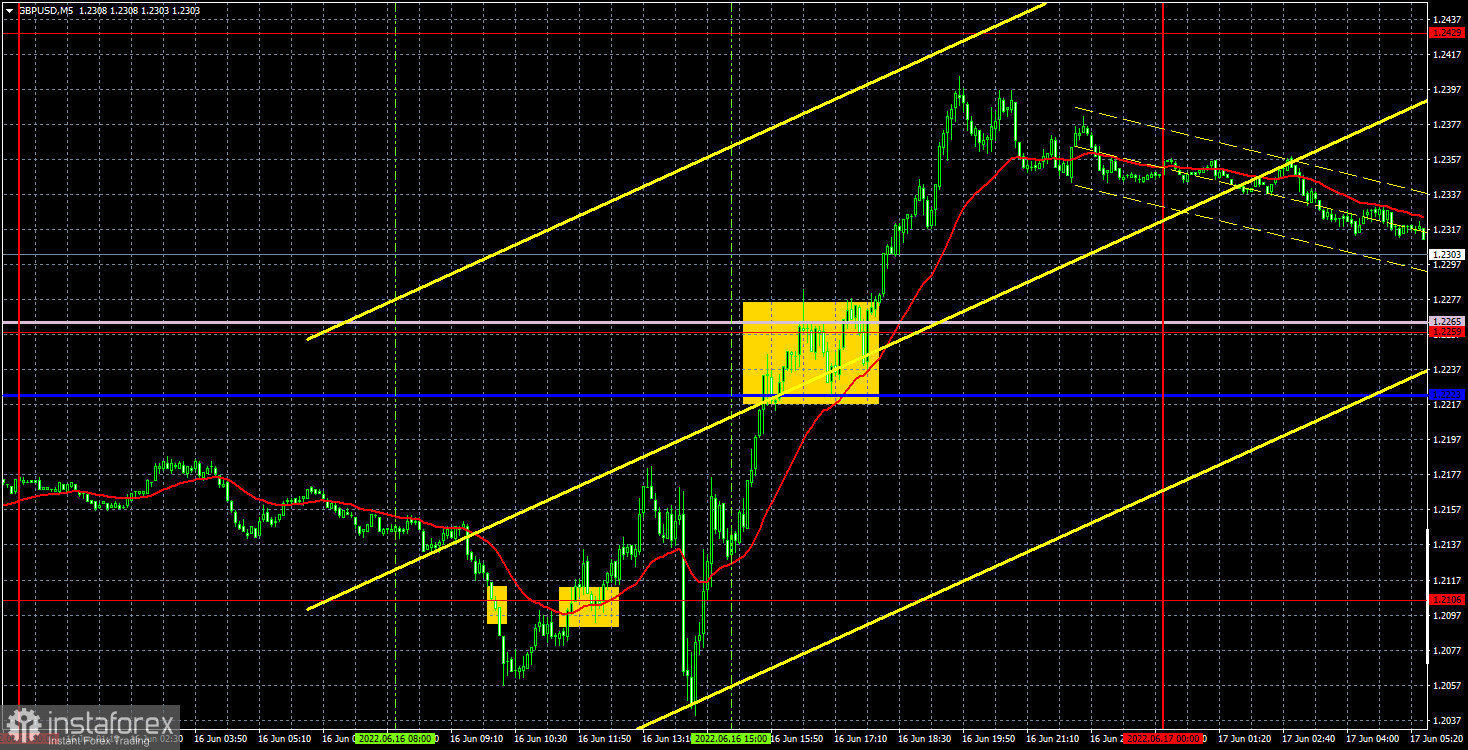
There were a fairly large number of signals on Thursday, but we put on the chart only those that needed to be worked out. The price broke the level of 1.2106 in the European trading session twice, and traders had to open deals for long and short positions. Both of these deals were closed at breakeven by Stop Loss. This was followed by the announcement of the results of the BoE meeting, so at that time it was definitely not necessary to open deals. The next buy signal was formed when the price crossed the Kijun-sen-Senkou Span B area. You could earn about 100 points on the long position, and it had to be closed manually in the late afternoon.
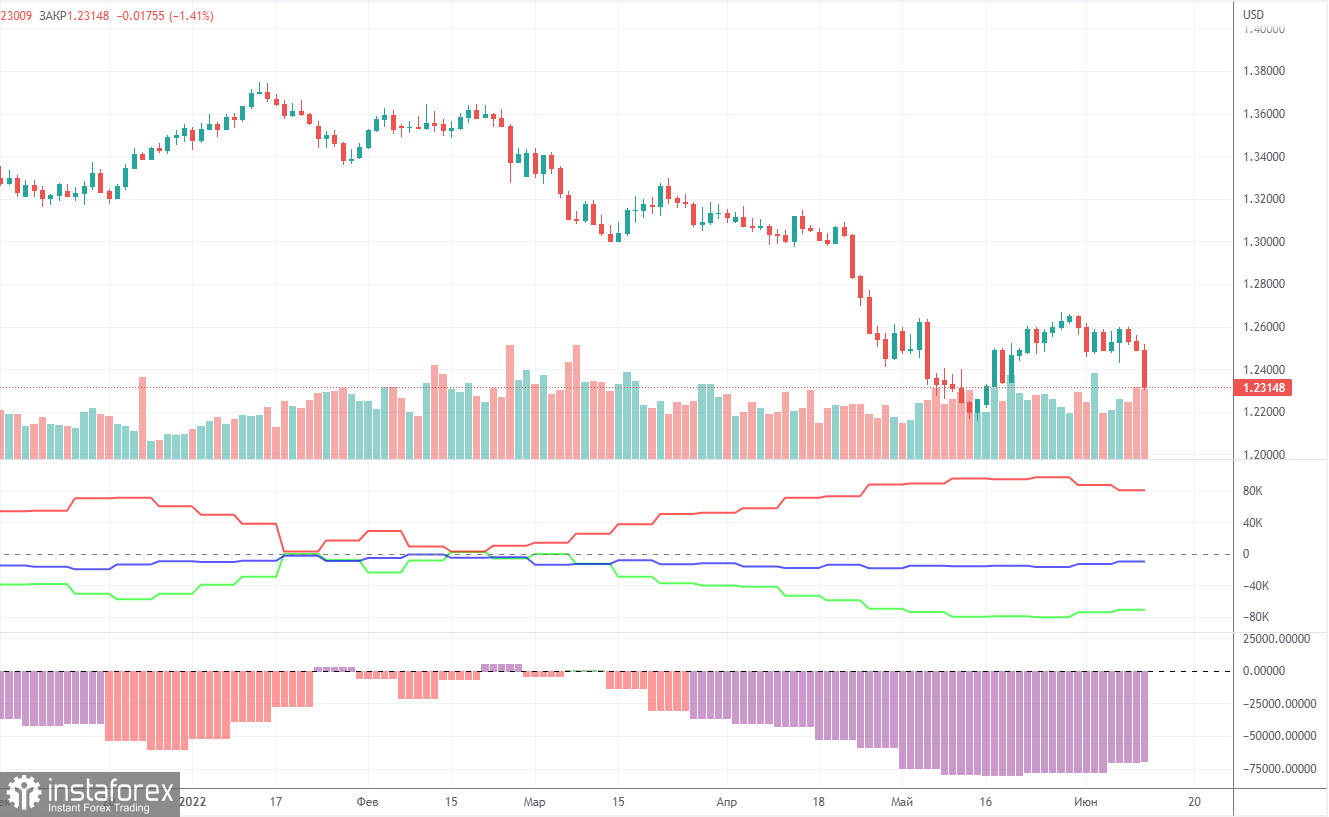
The latest Commitment of Traders (COT) report on the British pound showed insignificant changes. The non-commercial group opened 3,800 long positions and 500 shorts during the week. Thus, the net position of non-commercial traders increased by 3,300. However, the mood of major players still remains "pronounced bearish". And the pound, despite the growth of the net position, still resumed the fall. The net position has been falling for three months, which is perfectly visualized by the green line of the first indicator in the chart above or the histogram of the second indicator. Therefore, two increases in this indicator are unlikely to unambiguously indicate the end of the downward trend for the pound. The non-commercial group has a total of 105,000 shorts open and only 34,000 longs. Thus, the difference between these numbers is more than three times. We note that in the pound's case, the COT report data very accurately reflects what is happening in the market: the mood of traders is "very bearish", and the pound has been falling against the US dollar for a long time. In the past few weeks, the pound has shown growth, but even in the chart for this paragraph (daily timeframe), this movement looks very weak. Since in the pound's case, the COT report data reflects the real picture of things, we note that a strong divergence of the red and green lines of the first indicator often means the end of the trend. Therefore, now we can formally count on a new upward trend. However, weak geopolitical, fundamental and macroeconomic backgrounds for European currencies still put pressure on these currencies.
Overview of the EUR/USD pair. June 17. The Fed meeting remains in the past, but will not disappear from the memory of traders.
Overview of the GBP/USD pair. June 17. The Bank of England raised the key rate for the fifth time, the market ignored it again, the worst is yet to come.
Forecast and trading signals for EUR/USD on June 17. Detailed analysis of the movement of the pair and trading transactions.
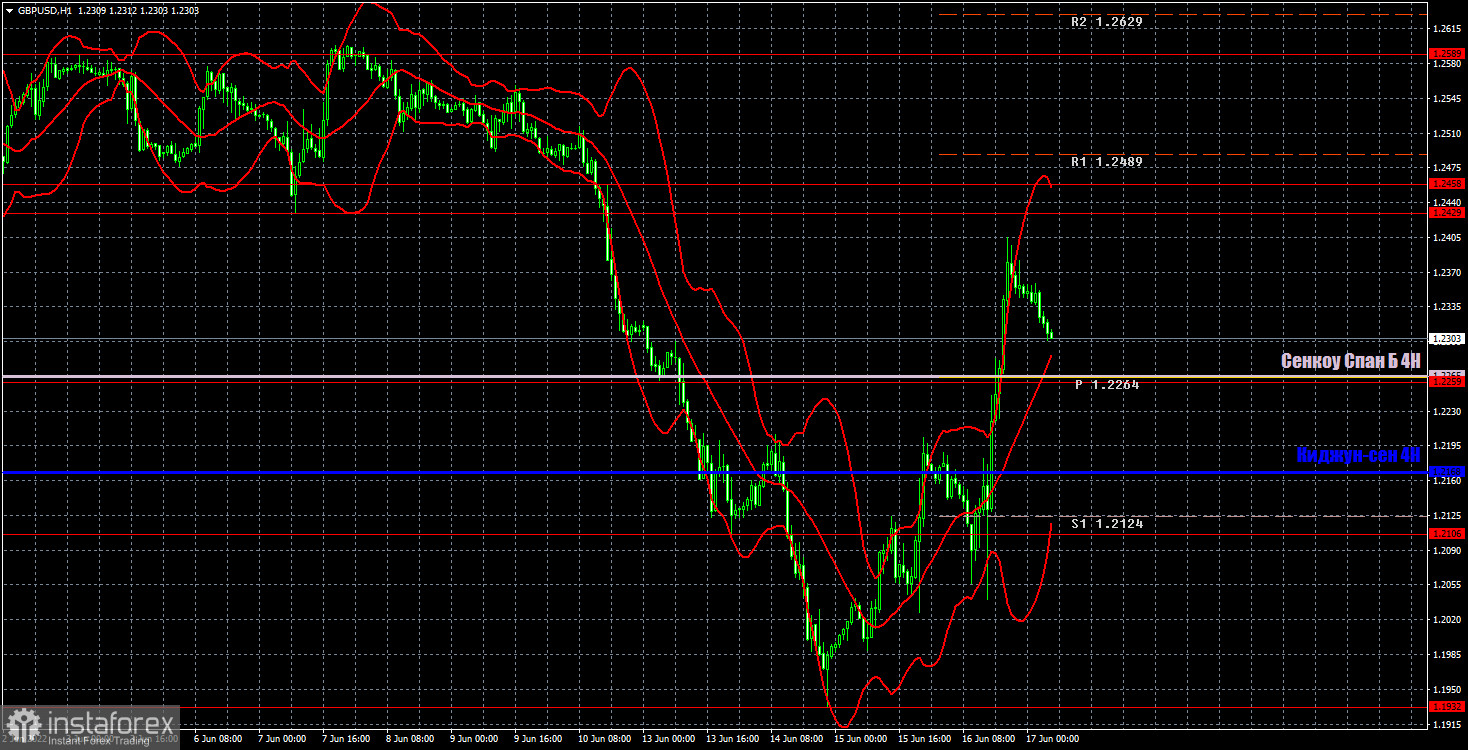
On the hourly timeframe, we see the strongest growth that the pair showed on Wednesday and Thursday. Let us now turn our attention to the fall that preceded it. And we understand that even such a strong growth of the pound does not change anything globally. The pound has taken a step towards possibly forming an upward trend. This move is strong. But the pound went down not with steps, but with jumps. In general, we believe that the downward trend may well resume. Today, we highlight the following important levels: 1.1932, 1.2106, 1.2259, 1.2429, 1.2458, 1.2589. Senkou Span B (1.2265) and Kijun-sen (1.2168) lines can also be sources of signals. Signals can be "rebounds" and "breakthrough" of these levels and lines. The Stop Loss level is recommended to be set to breakeven when the price passes in the right direction by 20 points. Ichimoku indicator lines can move during the day, which should be taken into account when determining trading signals. The chart also contains support and resistance levels that can be used to take profits on trades. No major events are scheduled for Friday in the UK, while Fed Chairman Jerome Powell will be speaking in America and the industrial production report will be released.
Support and Resistance Levels are the levels that serve as targets when buying or selling the pair. You can place Take Profit near these levels.
Kijun-sen and Senkou Span B lines are lines of the Ichimoku indicator transferred to the hourly timeframe from the 4-hour one.
Support and resistance areas are areas from which the price has repeatedly rebounded off.
Yellow lines are trend lines, trend channels and any other technical patterns.
Indicator 1 on the COT charts is the size of the net position of each category of traders.
Indicator 2 on the COT charts is the size of the net position for the non-commercial group.
InstaForex analytical reviews will make you fully aware of market trends! Being an InstaForex client, you are provided with a large number of free services for efficient trading.

