 Stay
Stay 
Trading Conditions
Products
Tools


The GBP/USD currency pair showed approximately the same movement as the EUR/USD pair on Monday. There was a slight upward trend during the day, but the price constantly corrected and rolled back down. Despite the fact that the volatility was not the weakest, in comparison with the previous weeks it was not high. The euro and the pound continue to move almost identically, which still indicates the highest influence on the rate of both pairs of the US dollar and the fundamental background from overseas. There was not a single important report published either in Britain or in the US on Monday, so there was nothing for traders to react to. Today the situation will not change, but the report on British inflation will be released on Wednesday. We cannot say that this report will change everything, but it can still affect the pair's movement. But Federal Reserve Chairman Jerome Powell's speeches in the US Congress are unlikely to affect the dollar, since just last week he made two speeches.
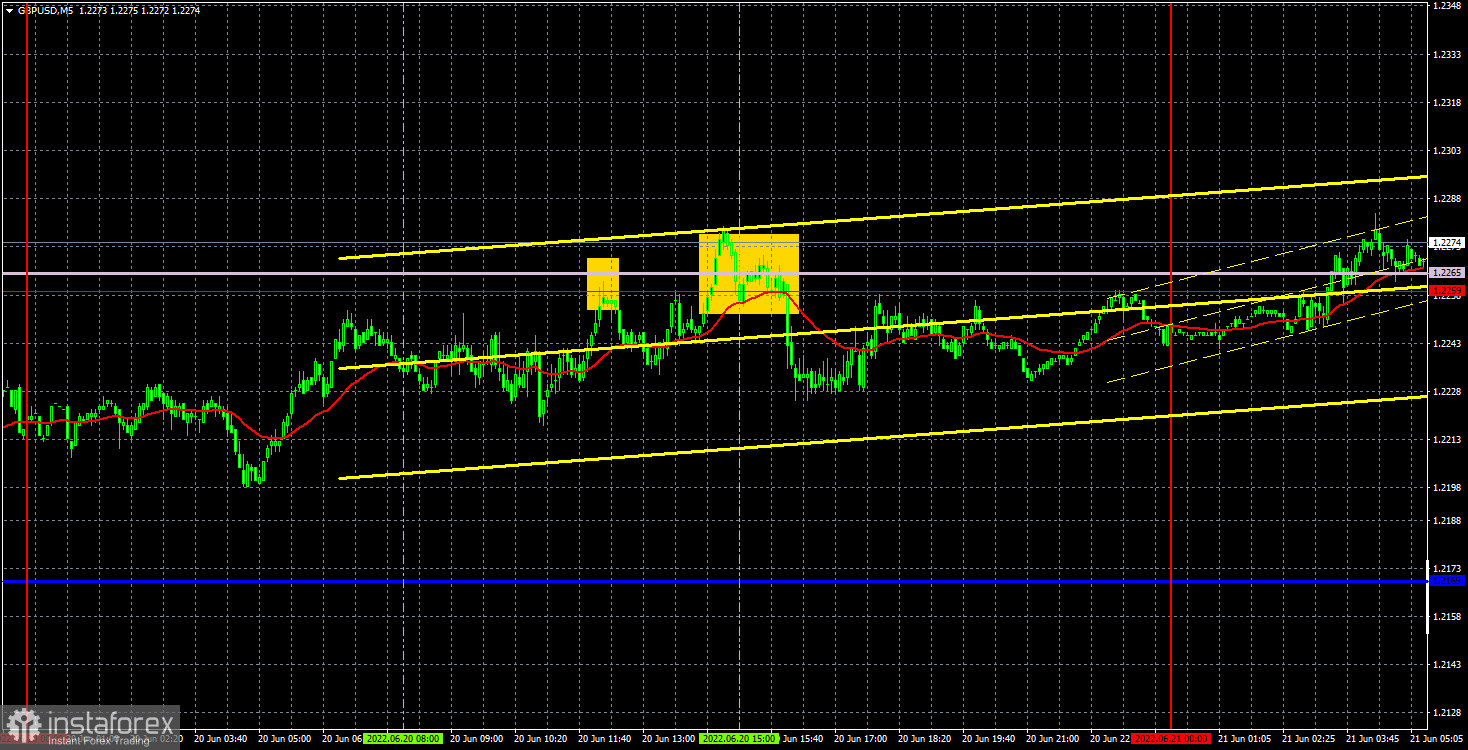
There were only two trading signals yesterday. Both are far from the best and most accurate. First, the pair bounced off the extreme level of 1.2259, but failed to go down even 20 points so that traders could set Stop Loss to breakeven, and then it also bounced off the Senkou Span B line. Although, to be honest, it is very difficult to call this a rebound. The pair first overcame this line, and within the next half hour returned back below it. But in any case, the signal should have been worked out, and it turned out to be false, like the first one. Therefore, it turned out one could open two deals, but both turned out to be unprofitable. The day turned out to be very unfortunate.
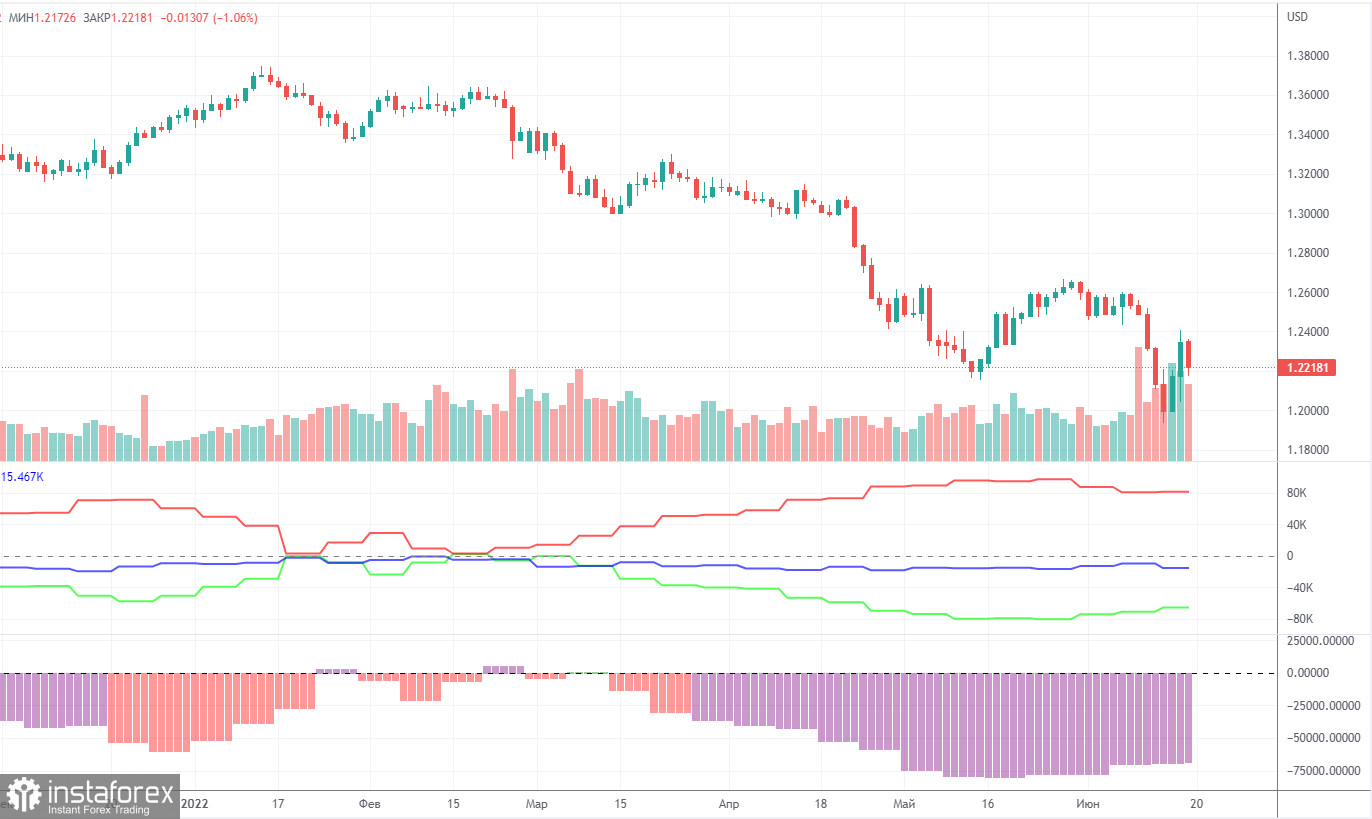
The latest Commitment of Traders (COT) report on the British pound showed insignificant changes. During the week, the non-commercial group closed 5,200 long positions and 10,500 short positions. Thus, the net position of non-commercial traders increased by 5,300. However, the mood of major players still remains "pronounced bearish". And the pound, despite the growth of the net position, still continues to fall. The net position has been falling for three months, which is perfectly visualized by the green line of the first indicator in the chart above or the histogram of the second indicator. Therefore, two or three insignificant increases in this indicator hardly unequivocally indicate the end of the downward trend for the pound. The non-commercial group has a total of 95,000 short positions open and only 29,000 long positions. As you can see, the difference between these numbers is more than three times. We note that in the case of the pound, the COT report data very accurately reflects what is happening in the market: the mood of traders is "very bearish", and the pound has been falling against the US dollar for a long time. In the past few weeks, the pound has been trying to show growth, but even in the chart for this paragraph (daily timeframe), these attempts look pathetic. Since in the case of the pound, the COT report data reflects the real picture of things, we note that a strong divergence of the red and green lines of the first indicator often means the end of the trend. Therefore, formally now we can count on a new upward trend. However, weak geopolitical, fundamental and macroeconomic backgrounds for European currencies still put pressure on them.
Overview of the EUR/USD pair. June 21. We understand the mood of the foreign exchange market.
Overview of the GBP/USD pair. June 21. What to expect from British inflation?
Forecast and trading signals for EUR/USD on June 21. Detailed analysis of the movement of the pair and trading transactions.
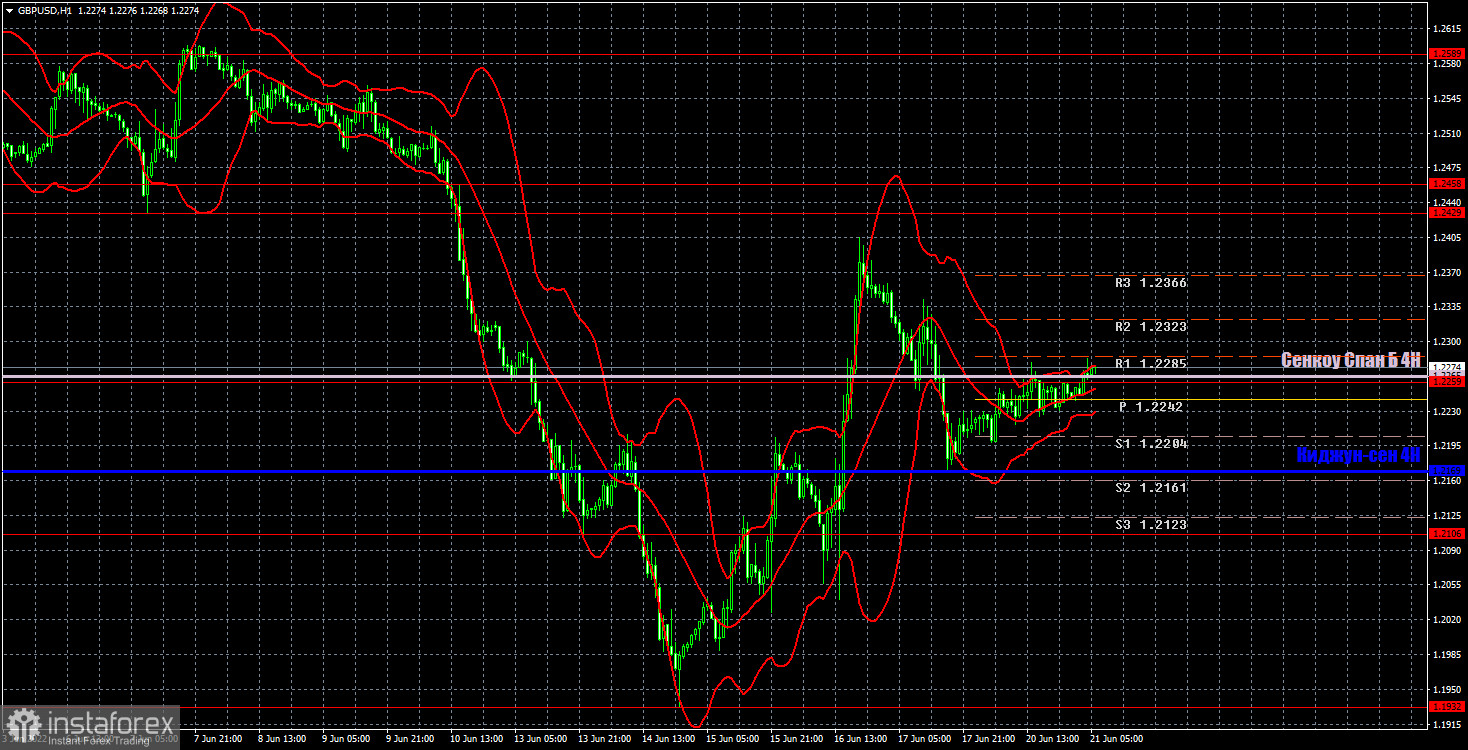
We see on the hourly timeframe the strongest increase that the pair showed on Wednesday and Thursday, and the strong fall that was shown on Friday. Now the pair is in the stage of consolidation and is located between the important lines Senkou Span B and Kijun-sen. There is currently no flat, so these lines can be used. But still, we want to warn that this week's movements can be as unattractive as possible. Today, we highlight the following important levels: 1.1932, 1.2106, 1.2259, 1.2429, 1.2458, 1.2589. Senkou Span B (1.2265) and Kijun-sen (1.2169) lines can also be sources of signals. Signals can be "rebounds" and "breakthroughs" of these levels and lines. The Stop Loss level is recommended to be set to breakeven when the price passes in the right direction by 20 points. Ichimoku indicator lines can move during the day, which should be taken into account when determining trading signals. The chart also contains support and resistance levels that can be used to take profits on trades. No important or interesting events in the US and Great Britain for Tuesday. The main task of the pound for today is to settle above the Senkou Span B.
Support and Resistance Levels are the levels that serve as targets when buying or selling the pair. You can place Take Profit near these levels.
Kijun-sen and Senkou Span B lines are lines of the Ichimoku indicator transferred to the hourly timeframe from the 4-hour one.
Support and resistance areas are areas from which the price has repeatedly rebounded off.
Yellow lines are trend lines, trend channels and any other technical patterns.
Indicator 1 on the COT charts is the size of the net position of each category of traders.
Indicator 2 on the COT charts is the size of the net position for the non-commercial group.
InstaForex analytical reviews will make you fully aware of market trends! Being an InstaForex client, you are provided with a large number of free services for efficient trading.


