 Stay
Stay 
Trading Conditions
Products
Tools


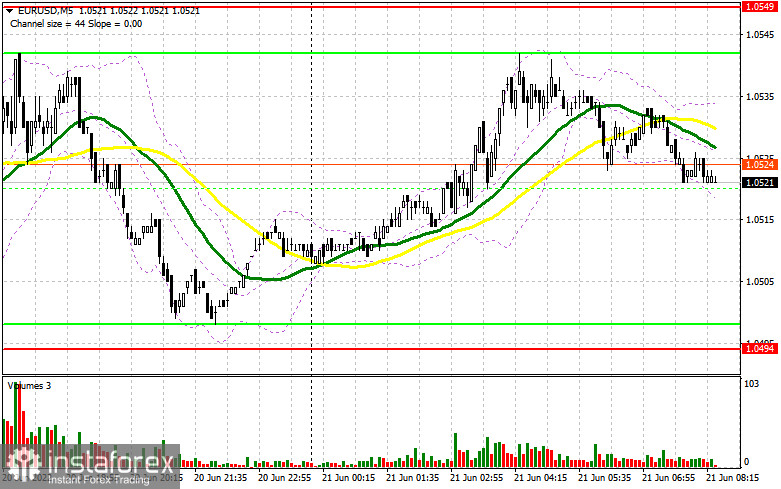
Conditions for opening long positions on EUR/USD:Yesterday, there were no signals to enter the market. The fact is that low volatility did not allow the pair to hit the expected levels. Let us focus on the 5-minute chart to clear up the market situation. Earlier, I asked you to pay attention to the level of 1.0549 to make a trading decision. The absence of the data from the eurozone led to a decline in the trading volume and volatility. As a result, the pair got stuck within the sideways channel and failed to reach neither support nor resistance levels indicated in the morning. The pair needed just several pips to test 1.0549. That is why we did not receive a signal to enter the market. In the second part of the day, the pair also failed to reach the mentioned levels despite the speech provided by Christine Lagarde and other ECB representatives. Notably, members of the US Fed also made some comments.
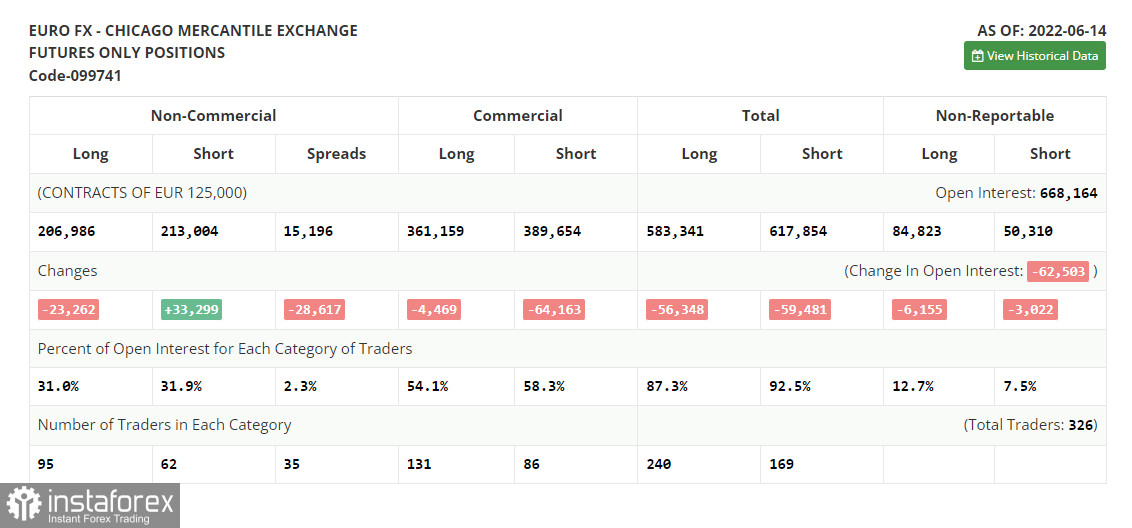
Before we focus on the future movement of the euro/dollar pair, let us take a look at the current situation in the futures market and the COT report. According to the COT report from June 14, the number of long positions tumbled, whereas the number of short positions increased, thus pointing to the formation of bearish sentiment. Since the ECB meeting took place long ago, traders were focused on the Fed's interest rate decision. Thus, the US regulator raised the benchmark rate by 0.75% at once, announcing its intention to continue combating the surging inflation. Since politicians stick to tight monetary policy, traders have to sell off risk assets and switch to the US dollar, thus boosting its price. The situation will hardly change, as monetary authorities will continue curbing inflation by means of higher interest rates. The COT report unveiled that the number of long non-commercial positions declined by 23,262 to 206,986, whereas the number of short non-commercial positions jumped by 33,299 to 213,004. Although the price of the euro is very low, it does not add to the attractiveness of the asset. Traders still prefer the greenback. Results of the week showed that the total non-commercial net position turned negative and decreased from 50,543 to -6,018. The weekly closing price dropped to 1.0481 against 1.0710.
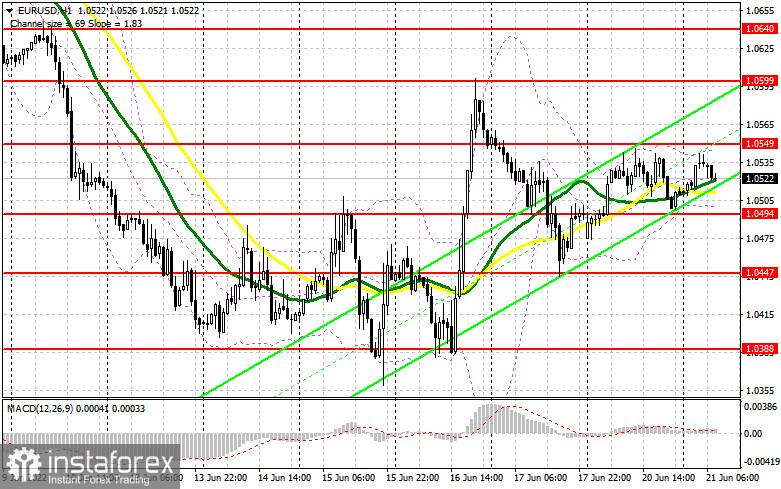
Today, the eurozone is not going to publish any report. Comments that will be provided by ECB's McCaul will hardly cause a jump in the market volatility. Yesterday, the market ignored even Chrisitne Lagarde's speech. However, she did not tackle the monetary policy issue. German Buba Mauderer's announcements are also unlikely to determine the euro's future trend. Bulls should do their best to boost the pair. To do so, they should primarily protect the nearest level of 1.0494. Slightly above this level, there are bullish moving averages. Only a false break of this level will give a long signal with the target at the intermediate resistance level of 1.0549. A break and downward test of this level may affect sellers' stop orders, thus providing traders with a long signal. In this case, the euro/dollar pair may climb to the high of 1.0599. The next target is located at 1.0640, where it is recommended to lock in profits. If the pair drops and buyers fail to protect 1.0494, the pair may enter the sideways channel. In this case, traders should be very cautious when entering the market. It will be better to go long after a false break of the support level of 1.0429. It is also possible to buy the asset from 1.0360 or lower – from 1.0306, expecting a rise of 30-35 pips.
Conditions for opening short positions on EUR/USD:
The longer the euro stays below 1.0549, the more chances bears will have to form a downtrend. If the euro/dollar pair increases in the first part of the day, only a false break of the intermediate resistance level of 1.0549 will give a sell signal with the target at the support level of 1.0494. A lot depends on this level. A break and settlement below this level as well as an upward test will give an additional sell signal that will affect buyers stop orders. In this case, the pair may slide to 1.0429. However, traders should be very cautious when opening short positions. The fact is that bulls may benefit from the correction and enlarge the volume of long positions. Since the euro is significantly oversold, traders will hardly increase the volume of short positions. A break and settlement below 1.0429, will push the euro to 1.0360, where it is recommended to leave the market. If the pair increases during the European session and bears fail to protect 1.0549, it will be better to avoid selling until the price hits 1.0599. A false break of this level could launch the downtrend. It is also possible to sell the euro/dollar pair after a bounce off the high of 1.0640 or higher – from 1.0663, expecting a decline of 30-35 pips.
Signals of indicators:
Moving Averages
Trading is performed above 30- and 50-day moving averages, thus pointing to bulls' attempt to push the euro higher.
Note: The period and prices of moving averages are considered by the author on the one-hour chart that differs from the general definition of the classic daily moving averages on the daily chart.
Bollinger Bands
A break of the lower limit of the indicator at 1.0500 will cause a decline. A break of the upper limit of the indicator at 1.0550 will lead to a rise.
Description of indicatorInstaForex analytical reviews will make you fully aware of market trends! Being an InstaForex client, you are provided with a large number of free services for efficient trading.

